Product Disapproval on Ad Platforms Is Usually Lying
A 98% Google disapproval rate and 753 rejected Meta products both turned out to be noise. How I audited the real cause behind product disapproval on ad platforms.
By Mike Hodgen
The headline number that almost cost me my entire ad budget
My ad agency called me one afternoon with what they framed as bad news but really treated as settled fact. My entire product line was "against policy." I should accept it and move on. Paid acquisition, they implied, just wasn't going to happen for a brand like mine.
The numbers backed them up, or seemed to. Google Merchant Center showed roughly a 98% disapproval rate across my catalog. Meta showed 753 products marked PRODUCT_NOT_APPROVED. If you saw those two numbers cold, you'd reach the same conclusion the agency did.
I run a DTC fashion brand out of San Diego. We sell apparel in a category the platforms flag as sensitive. So the story wrote itself: the platforms have a hard wall against my category, paid is dead on arrival, focus on organic and email and call it a day.
Here's the thing. Both of those numbers were lying.
Not lying in some conspiratorial sense. Lying in the way a fever lies about what's actually wrong with you. A 98% disapproval rate and 753 rejected products sound like a verdict on my products. They were nothing of the sort. The real causes turned out to be the most boring things imaginable: a broken multi-currency feed and a pile of honest out-of-stock flags.
When I actually pulled the raw data, the Google number inverted to 98% approved and the Meta number collapsed to a real ad disapproval rate of 0.16%.
The lesson I want every business owner to take from this: never trust the aggregate rejection number on a product disapproval ad platform dashboard. It's a symptom, not a diagnosis.
Why the scary aggregate number is almost never the real story
Before I walk through the two audits, you need the core idea, because it applies to every paid channel you run.
Dashboards report symptoms, not causes
A disapproval rate is a rollup. It blends three completely different things into one terrifying percentage: data-quality errors, inventory states, and genuine policy violations. A price that doesn't match its currency code lands in the same bucket as a product that genuinely breaks an ad clause. The dashboard doesn't care. It just adds them all up and shows you a number designed to make you panic.
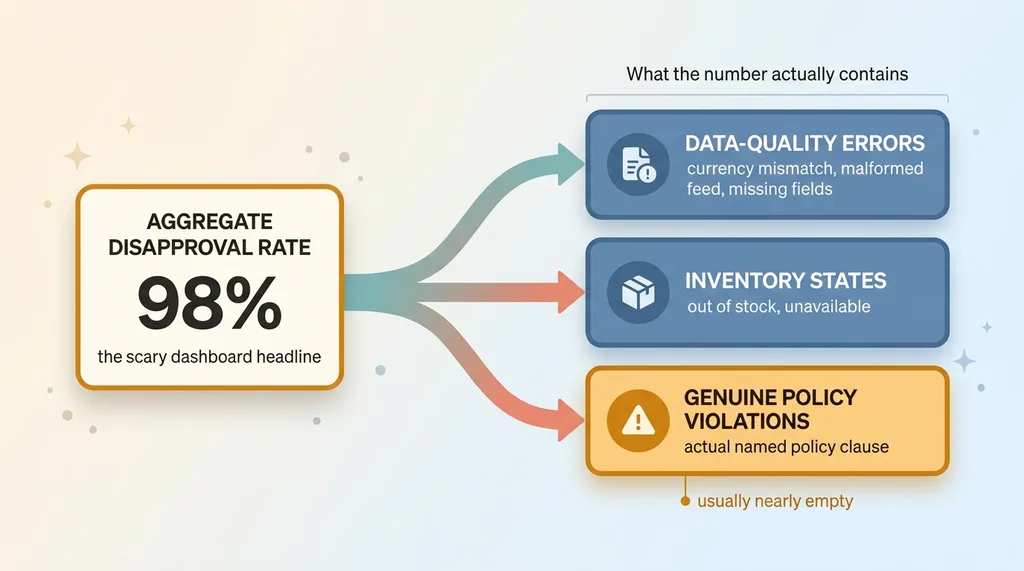 Aggregate disapproval number breaks into three buckets
Platforms are good at surfacing the symptom. They are bad, often deliberately, at handing you the cause. You get "disapproved." You rarely get "disapproved because line 4,201 of your feed has a USD price tagged with a EUR currency code."
The 'sensitive category' assumption does the platform's work for it
Now add confirmation bias. If you already believe your category is risky, a high disapproval number confirms the fear instantly. You stop investigating. You accept the wall. And in doing so, you do the platform's gatekeeping for it, for free.
This is the trap my agency fell into. They saw a sensitive-category brand and a 98% disapproval rate and connected the dots in the laziest possible way. The number matched the story they already believed, so they never questioned the number.
The only way through is to stop reading the dashboard headline and go pull the raw, per-item reasons from the platform APIs. This is the same audit discipline I use to monitor competitors: never trust the summary view when the granular data is one API call away. The summary exists to be glanced at. The cause lives in the rows underneath it.
That's the entire game. Everything in the next two sections is just me applying that one principle.
Google: a 98% disapproval that was a broken feed, not a policy wall
Let me start with Google, because the gap between the headline and the truth was the widest.
The multi-currency feed was the real culprit
The ~98% Google Merchant Center disapproval was a data-quality artifact. I was running multi-currency feeds, and they were broken in a way that cascaded. Price and currency mismatches, malformed feed structure, missing fields that should have been inherited but weren't. Each broken row got rejected, and because the breakage was structural, it hit almost everything.
Google wasn't reading my product descriptions and deciding my apparel was too racy. Google was choking on my feed formatting and rejecting items before any human-style policy review even mattered.
A clean US feed flipped to 98% approved
So I isolated a single clean US feed. One currency. Correct structure. Required fields populated. Nothing fancy.
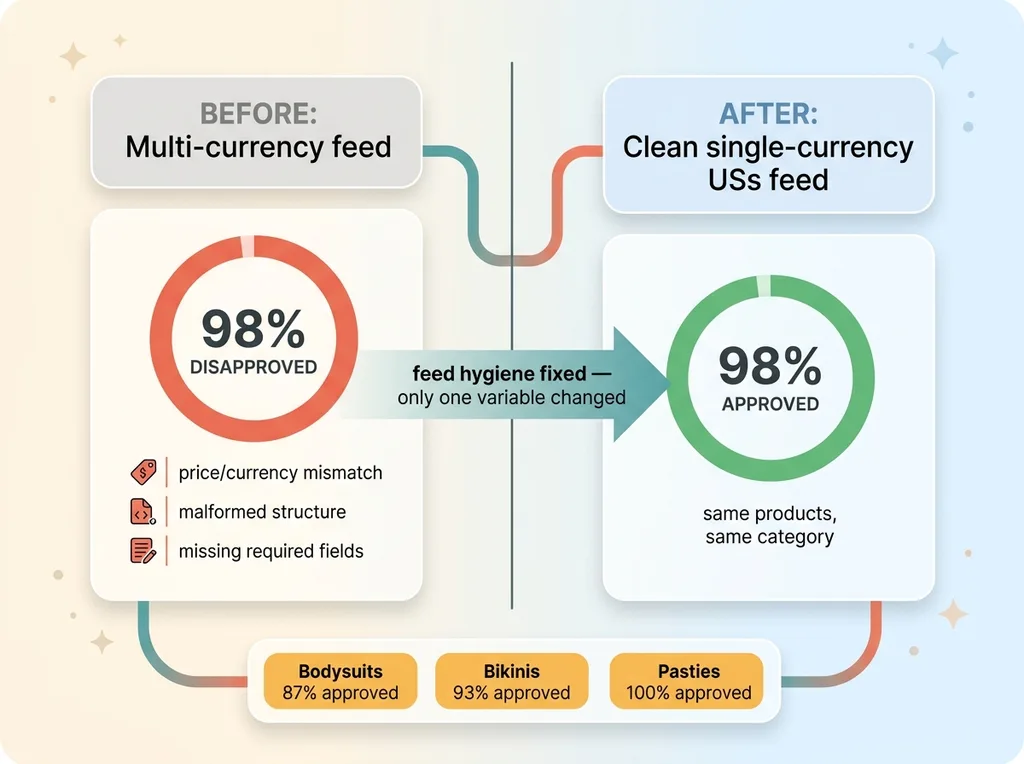 Google feed before vs after cleanup (98% inverted)
The number didn't improve. It inverted. From roughly 98% disapproved to 98% approved.
That's not a rounding gain. That's proof the disapproval was never about the products. When I rebuilt the feed properly, I rebuilt the Google feed and got 3,819 products approved overnight. Same products. Same category. Same supposedly hostile platform. The only thing that changed was the feed hygiene.
The item types that proved the point
Here's the part that should bury the category-wall theory for good. When the feed was clean, the supposedly "sensitive" item types were overwhelmingly approved.
Bodysuits came in around 87% approved. Bikinis around 93%. Pasties, the single item type you'd expect to be the most policy-fraught, hit 100% approved.
The most "risky" product on my entire catalog had a perfect approval rate once the feed was clean.
So when people worry about Google Merchant Center adult content rejections, they're usually worried about the wrong thing. In the overwhelming majority of cases I've seen, the fear of a content policy wall is really a fear of feed hygiene wearing a costume. Fix the feed, and the category fear evaporates with it.
Meta: 753 'not approved' products that weren't blocking a single ad
Meta told a different story with the same moral. The 753 PRODUCT_NOT_APPROVED entries looked like a catastrophe. They were almost entirely noise.
The rejections lived on a secondary surface
The first thing I checked: where do these rejections actually live? Turns out all 753 were confined to the Facebook and Instagram Shop tab. That's a secondary shopping surface, the in-app storefront. I wasn't running a single ad against it.
The rejections were sitting on a channel I wasn't using. It's like getting a stack of parking tickets for a car you don't drive. Technically real, completely irrelevant to the thing I actually cared about, which was ad delivery.
Real ad disapproval was 0.16%
When I looked at the surface that mattered, the catalog feeding my actual ad campaigns, the real ad disapproval rate was 0.16%.
Not 98%. Not even 5%. Sixteen hundredths of one percent. That's the number that determines whether I can run paid acquisition on Meta, and it was effectively zero. The AI system that runs our Meta ads was never actually blocked. The catalog dashboard just made it look like it was.
60% of it was just out-of-stock
Now break down the 753 itself. The single biggest reason code was PRODUCT_OUT_OF_STOCK, at roughly 60% of the rejections.
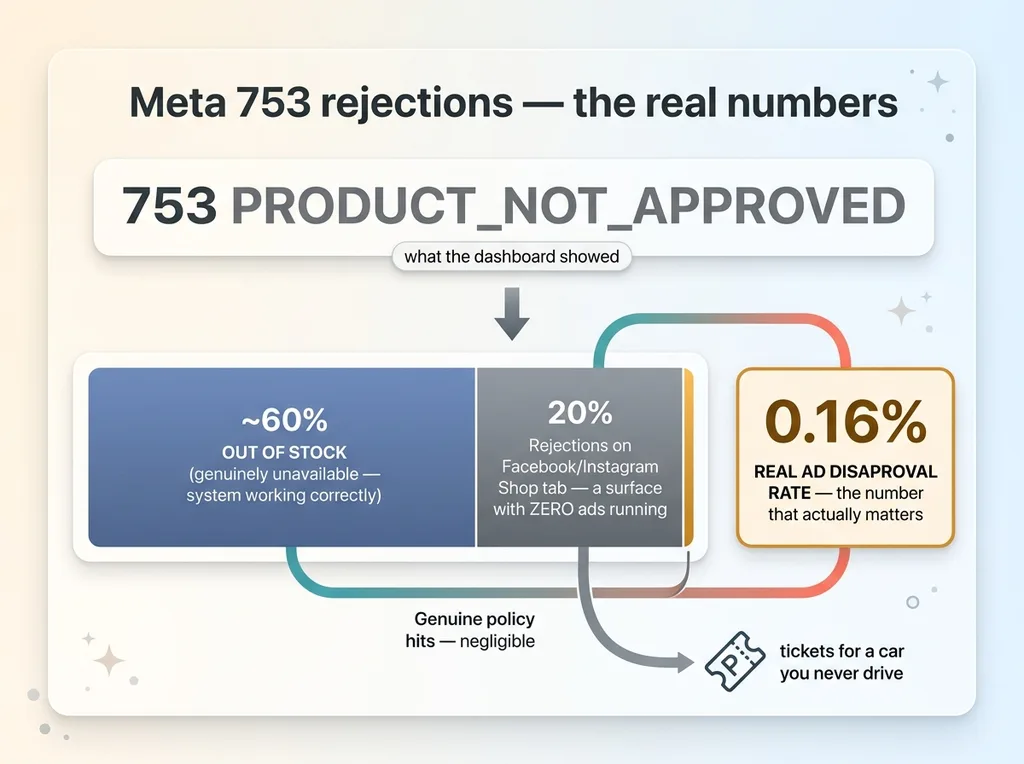 Meta 753 rejections breakdown, the real numbers
And that's not a sync bug. That's the truth. Those products were genuinely out of stock. Meta was correctly declining to show a Shop listing for inventory I didn't have. That's the system working, not failing.
So the scary 753 broke down into three honest piles. A big chunk was rejections on a surface I didn't run ads against. Most of the rest was accurate out-of-stock signals. And what was left, the genuine policy hits, was a tiny sliver that had no meaningful effect on my campaigns.
The takeaway: a "Meta catalog product not approved" status is a surface-and-inventory question first, and a category verdict almost never. Before you assume Meta banned your products, find out which surface the rejection lives on and how many are just out of stock.
How to run your own ad feed disapproval audit
You can run this exact process on your own catalog. Here's the repeatable method I use.
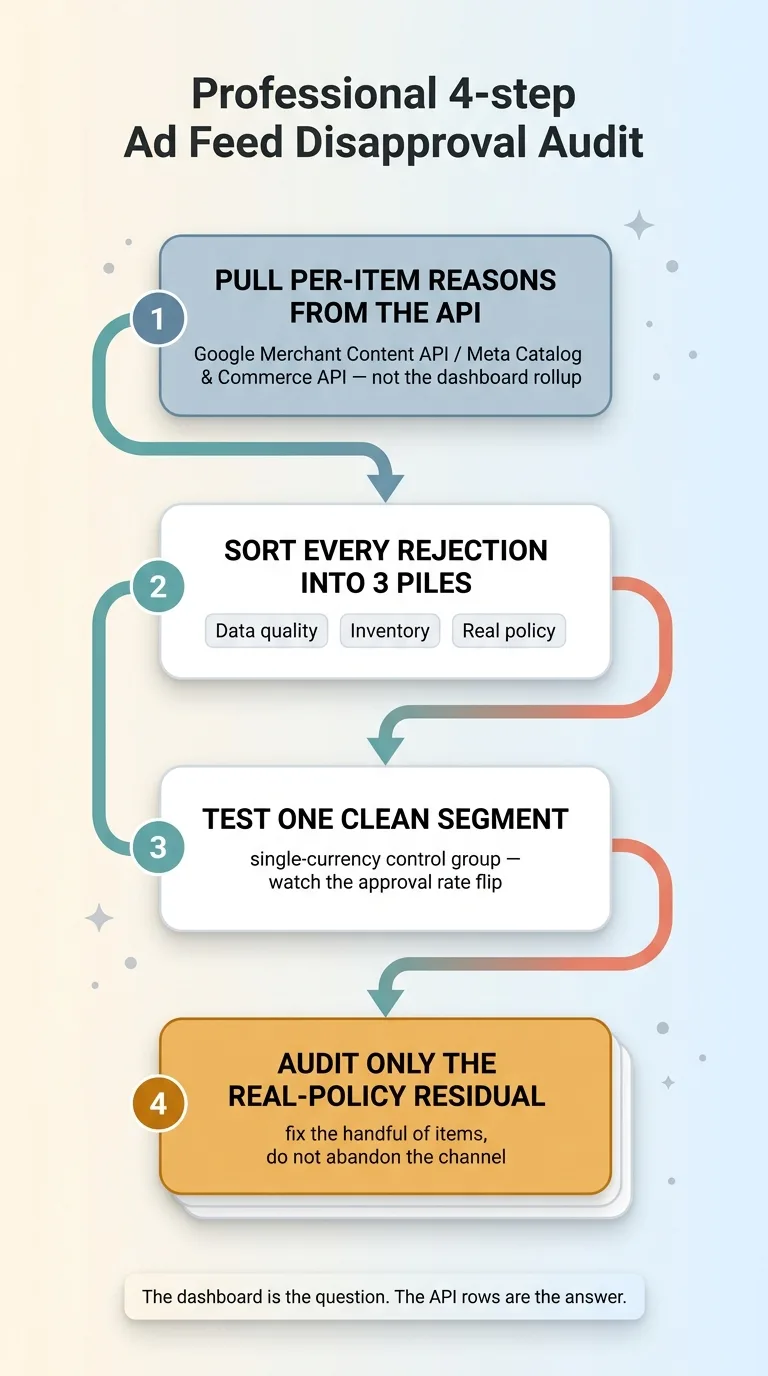 The 4-step ad feed disapproval audit process
Pull per-item reasons from the API, not the dashboard
Step one. Stop reading the rollup. Pull the raw, per-item disapproval reasons directly from the source. For Google, that's the Merchant Center Content API. For Meta, it's the Catalog and Commerce APIs.
The dashboard gives you a percentage. The API gives you a reason code on every single item. You cannot diagnose anything from the percentage. You can diagnose everything from the reason codes. This is the non-negotiable first move of any real ad feed disapproval audit.
Separate data quality from inventory from real policy
Step two. Bucket every rejection into three piles.
- Data-quality errors: feed structure problems, currency or price mismatches, missing required fields, malformed identifiers.
- Inventory states: out of stock, unavailable, anything that's a temporary truth about your stock rather than a problem with the listing.
- Genuine policy violations: items that hit an actual named policy clause.
Most owners never do this. They see one big number and assume it's all pile three. In my case, pile three was nearly empty. Almost everything sorted into data quality (Google) or inventory (Meta).
Test a single clean segment to isolate the variable
Step three. Isolate one clean segment and watch what happens to the approval rate without the noise. For me that was a single-currency US feed. One variable changed, and the result was unambiguous: the approval rate flipped from 98% disapproved to 98% approved.
A clean segment is your control group. If the approval rate jumps once you remove the data-quality noise, you've proven the disapproval was never about your products.
Step four. Only treat the residual real-policy bucket as an actual category problem. And even then, audit it item by item. A handful of genuine policy hits is a fixable list, not a banned channel. You don't abandon paid because three products tripped a clause. You fix the three products.
What to say when your agency tells you the whole line is against policy
So let's answer the question directly, because it's the one that nearly cost me a channel. Your agency says your whole product line is against policy. Should you just accept that?
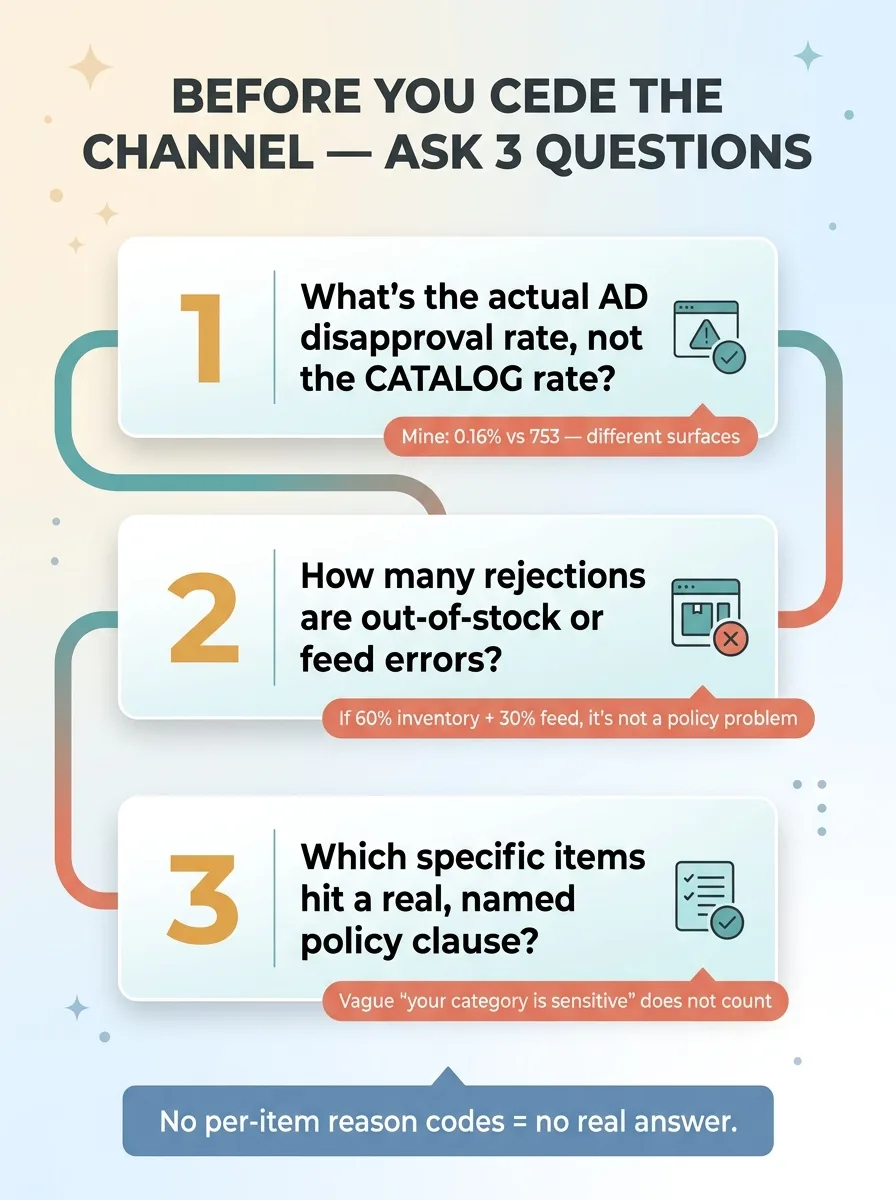 Three questions to ask your agency before accepting a disapproval
No. Not without seeing the per-item reason codes. Full stop.
An agency that reads you the aggregate disapproval number and shrugs is doing the platform's gatekeeping for it. They're treating a symptom as a verdict, and they're cutting off a revenue channel based on a number they never investigated. That's not strategy. That's surrender dressed up as expertise.
Ask them three questions before you accept anything:
- What's the actual ad disapproval rate, not the catalog disapproval rate? These are different numbers living on different surfaces. Mine were 0.16% versus 753.
- How many of these rejections are out-of-stock or feed errors? If 60% are inventory and 30% are feed structure, you don't have a policy problem. You have a feed and a warehouse problem.
- Which specific items hit a real, named policy clause? Make them point to the clause and the item. Vague "your category is sensitive" answers don't count.
In both of my cases, the "your category is banned" story collapsed under about five minutes of API data.
I'll be honest about the limit, because this matters. Sometimes there genuinely is a policy wall. Some categories really are restricted, and no feed fix changes that. But you owe yourself the audit before you cede the channel. Don't take the platform's word, and don't take your agency's word, until you've seen the reasons line by line.
The pattern: chase the cause, not the number
Across both platforms, the story was identical. Neither Google nor Meta had a hard wall against my category. The headline rejection numbers were a broken multi-currency feed and a pile of honest out-of-stock flags. That's it. The most boring causes possible, dressed up as an existential threat to my paid acquisition.
What saved real ad spend wasn't a clever workaround or a policy appeal. It was refusing to trust the aggregate and going to the raw per-item data. The dashboard was the starting question. The API rows were the answer.
This is the same discipline I bring to every system I build. The number on the screen is where you begin the investigation, never where you end it. A scary metric with no cause attached is just an invitation to go look harder.
If your paid channels look blocked, and your agency or the platform is reading you a frightening number, the fix is almost always finding the dull, real cause underneath it. Broken feed. Wrong surface. Out of stock. Three missing fields. The villain is rarely your products.
If you want someone to audit the actual cause instead of accepting the headline, that's exactly the kind of work I do. No drama, just the raw data and what it actually says.
Want to explore what AI could do for your business?
Book a free 30-minute strategy call. No pitch deck, no sales team, just a real conversation about your operations and where AI actually fits.
Get AI insights for business leaders
Practical AI strategy from someone who built the systems — not just studied them. No spam, no fluff.
Hodgen.AI
Ready to automate your growth?
Book a free 30-minute strategy call with Hodgen.AI.
Book a Strategy Call