I Built an AI Competitive Intelligence Tool That Monitors 7 Competitors
How I built an AI competitive intelligence tool that tracks 7 competitors across 48 touchpoints automatically. Pricing, promos, reviews — all on autopilot.
By Mike Hodgen
Most businesses track competitors the way I used to — sporadically, incompletely, and always a step behind. For the first year of running my DTC fashion brand out of San Diego, I'd open a competitor's website maybe once a week, scroll through their new arrivals, glance at prices, and move on. That worked fine when I was watching two brands. Then the market got crowded. I built an AI competitive intelligence tool to fix the problem, and the data it surfaced in the first 90 days changed how I make decisions about pricing, product development, and positioning.
Manual Competitor Monitoring Breaks at 3 Competitors
Here's the math that made me stop doing this by hand.
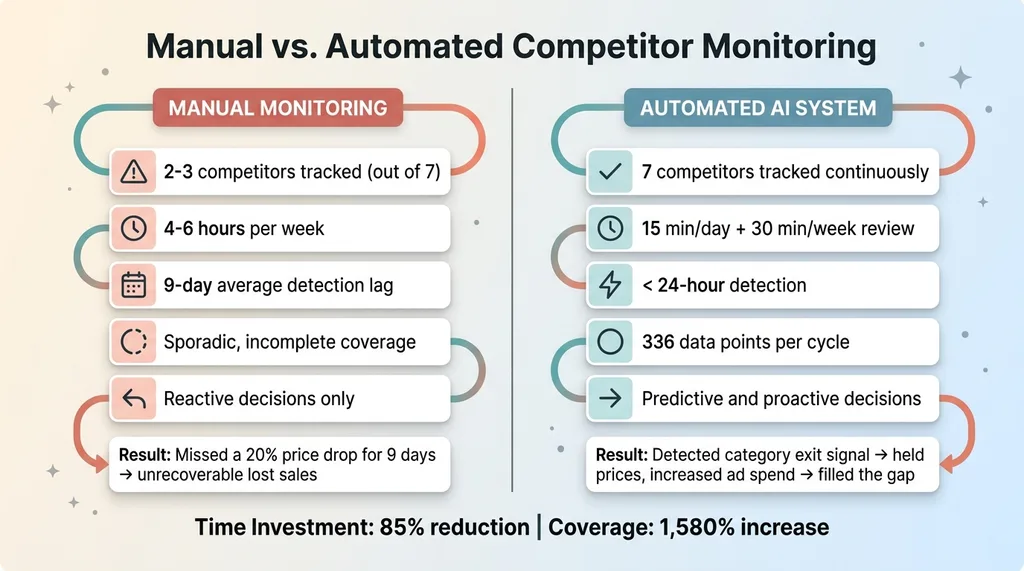 Manual vs Automated Monitoring Comparison
In DTC fashion, I compete with at least 7 brands at any given time across overlapping product categories. Each competitor has roughly 48 meaningful touchpoints I should be watching — pricing pages, new arrivals, promotional banners, collection pages, review sections, shipping policies, about pages, email signup offers, and more. That's 336 data points.
Checking 336 data points manually takes somewhere between 4 and 6 hours per week if you're being thorough. Nobody is thorough. What actually happens is you check 2 competitors semi-regularly, glance at a third when you remember, and completely ignore the other 4. You tell yourself you'll catch up next week. You don't.
The cost of that gap is real. One of my competitors dropped prices across their best-selling category by 20% on a random Wednesday. I didn't notice for 9 days. In DTC, 9 days of mispriced products against a competitor running a major promotion means lost sales you'll never recover. Customers don't come back to check if you've adjusted.
The core problem isn't laziness. It's that manual competitor monitoring doesn't scale past 3 competitors. Your brain can hold a rough mental model of 2-3 competitor strategies. Beyond that, you're guessing.
Most businesses I talk to fall into one of two camps: they either ignore competitors entirely ("we just focus on our own thing") or they obsess over one rival and miss the other six. Both approaches leave money on the table. Competitive intelligence isn't optional in a crowded market. But doing it by hand means you're always reacting to last week's moves instead of anticipating next week's.
The 48-Touchpoint Audit Framework
What I Actually Track Per Competitor
I organized the 48 touchpoints into six categories. Each one tells a different story about what a competitor is doing and why.
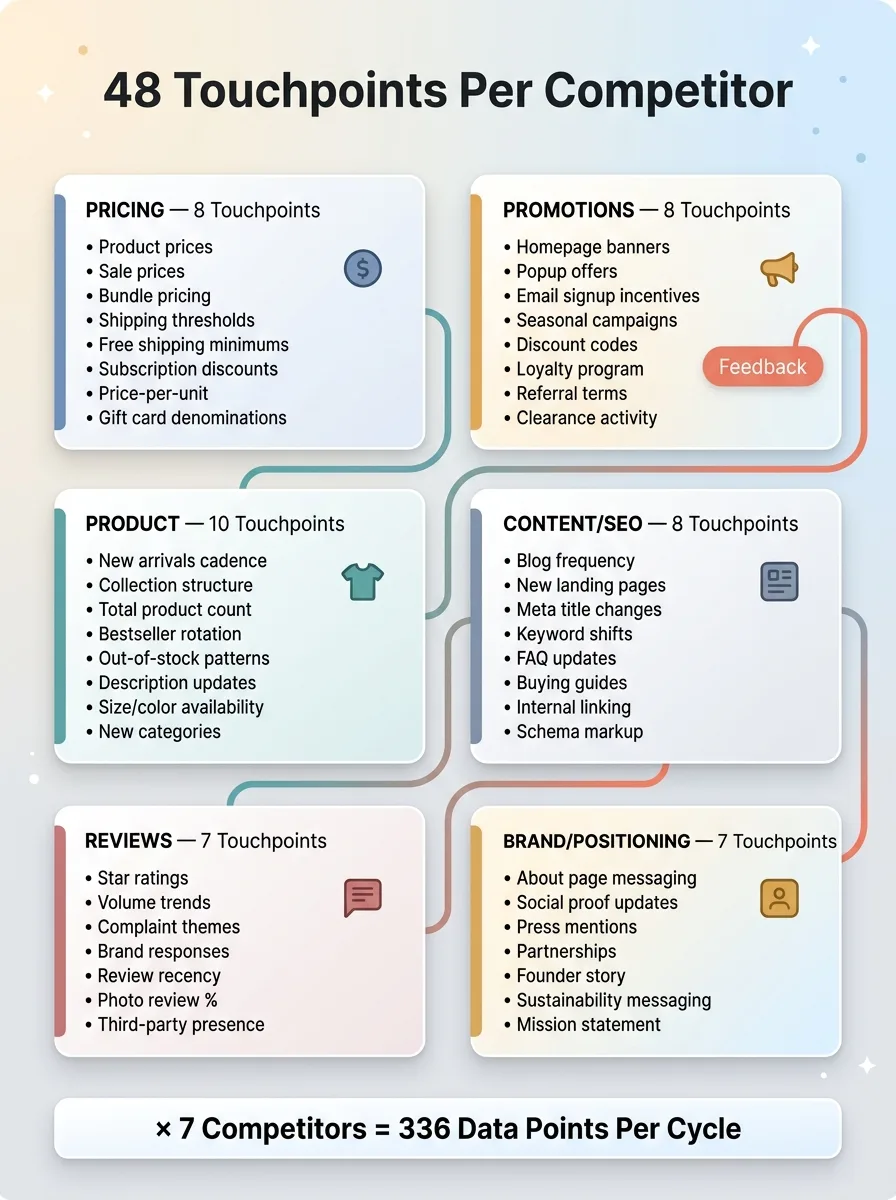 48-Touchpoint Audit Framework
Pricing (8 touchpoints): Product prices, sale prices, bundle pricing structures, shipping thresholds, free shipping minimums, subscription discounts, price-per-unit on multi-packs, and gift card denominations.
Promotions (8 touchpoints): Homepage banners, popup offers, email signup incentives, seasonal campaign messaging, visible discount codes, loyalty program changes, referral program terms, and clearance/sale page activity.
Product (10 touchpoints): New arrivals cadence, collection structure changes, total product count, bestseller rotation, out-of-stock patterns, product description updates, size/color availability, new category launches, product removals, and bundle or kit changes.
Content/SEO (8 touchpoints): Blog publishing frequency, new landing pages, meta title changes, keyword targeting shifts, FAQ updates, buying guide additions, internal linking patterns, and schema markup changes.
Reviews (7 touchpoints): Average star ratings, review volume trends, common complaint themes, brand response patterns, review recency, photo review percentage, and third-party review site presence.
Brand/Positioning (7 touchpoints): About page messaging, social proof updates (as seen in, customer count claims), press mentions, partnership announcements, founder story changes, sustainability messaging, and mission statement shifts.
Why Most Competitor Analysis Misses the Important Stuff
Most competitive analysis tools — and most analysts — focus almost entirely on pricing. Pricing matters, but it's maybe 20% of the intelligence picture.
Here's an example. When a competitor changes their free shipping threshold from $75 to $50, that's not just a pricing move. It tells you their average order value is probably dropping and they're trying to reduce cart abandonment. That single data point reveals more about their strategic position than their latest Instagram campaign.
Product assortment changes are even more telling. When a competitor quietly removes 30 products from a category and adds 15 in a different category, they're signaling where they see the market going. You won't catch that scrolling their site once a week.
I chose these 48 touchpoints specifically because they're the signals that predict competitive moves before those moves become obvious.
How Firecrawl Powers the Scanning Engine
Why I Chose Firecrawl Over Scrapers I Built Myself
I've written over 22,000 lines of custom Python across my AI toolkit. I know how to build web scrapers. I still didn't want to maintain 7 different site-specific scrapers for this project.
The reason is simple: competitor websites change their HTML structure constantly. A redesign, a platform migration, even a minor theme update can break a custom scraper overnight. I spent two weeks last year debugging a scraper that broke because a competitor switched from Shopify's Dawn theme to a custom build. Their product data moved from one div structure to a completely different one. Two weeks of lost monitoring for one competitor.
Firecrawl is a web scraping API that handles the parsing layer. You give it a URL, it returns clean, structured data — text content, metadata, pricing elements, whatever is on the page. When a site changes its layout, Firecrawl adapts. I don't have to rewrite parsing logic every time a competitor's developer pushes a CSS update.
That trade-off — giving up some control over the parsing layer to gain reliability — was worth it. I'd rather spend my engineering time on the intelligence layer than on maintaining scrapers.
Structuring the Crawl for Clean Data
The architecture runs on three layers.
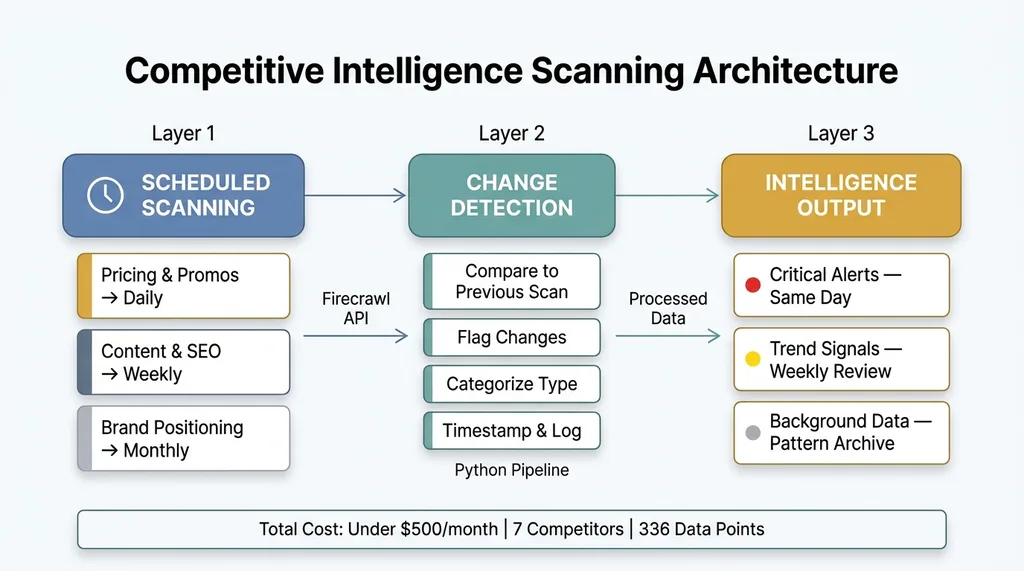 Three-Layer Scanning Architecture
Layer 1: Scheduled scanning. A cron job triggers Firecrawl to scan predefined URLs for each competitor. Not every touchpoint needs the same cadence. Pricing and promotional pages get scanned daily. Content and SEO touchpoints get scanned weekly. Brand positioning pages get scanned monthly. Over-scanning wastes API calls and generates noise. Under-scanning means you miss time-sensitive moves.
Layer 2: Change detection. My Python pipeline compares the current scan to the previous scan for each URL. It flags what changed, categorizes the type of change (pricing move, new product, promo launch, messaging shift), and timestamps everything. This creates a running changelog for each competitor.
Layer 3: Intelligence output. The processed data feeds into a structured competitor dashboard. Not a raw data dump — an organized audit that surfaces what actually matters. More on that in the next section.
The whole system runs on a basic server. No expensive infrastructure required. The total monthly cost for scanning 7 competitors across 48 touchpoints each is less than what most businesses spend on a single competitive intelligence analyst's weekly hours.
From Raw Data to Actionable Intelligence
The Automated Audit Report
This is where most monitoring tools stop and where an actual intelligence system starts. Raw data without interpretation is just noise.
Each scan cycle generates a structured report with three tiers:
Critical alerts — changes that require same-day review. A competitor launching a major site-wide sale. A bestselling product going out of stock across all sizes. A significant price drop in a category where we overlap directly.
Trend signals — changes that matter over time but don't need immediate action. A competitor publishing 3 blog posts this week when their average is 1. A gradual increase in their review volume. A slow rotation of their homepage featured products.
Background data — logged for pattern analysis but not actively surfaced. Minor copy changes, small metadata updates, incremental product additions.
The severity classification is what makes this usable. Without it, you're drowning in 336 data points every cycle and reacting to everything equally. With it, I spend about 15 minutes a day reviewing critical alerts and 30 minutes a week on trend analysis. Compare that to the 4-6 hours of manual monitoring I was doing badly before.
Turning Competitor Moves Into Decisions
Here's a concrete example. One competitor dropped their best-selling category prices by 15% on a Tuesday. My system flagged it as critical within 24 hours. The question wasn't whether to respond — it was understanding the why.
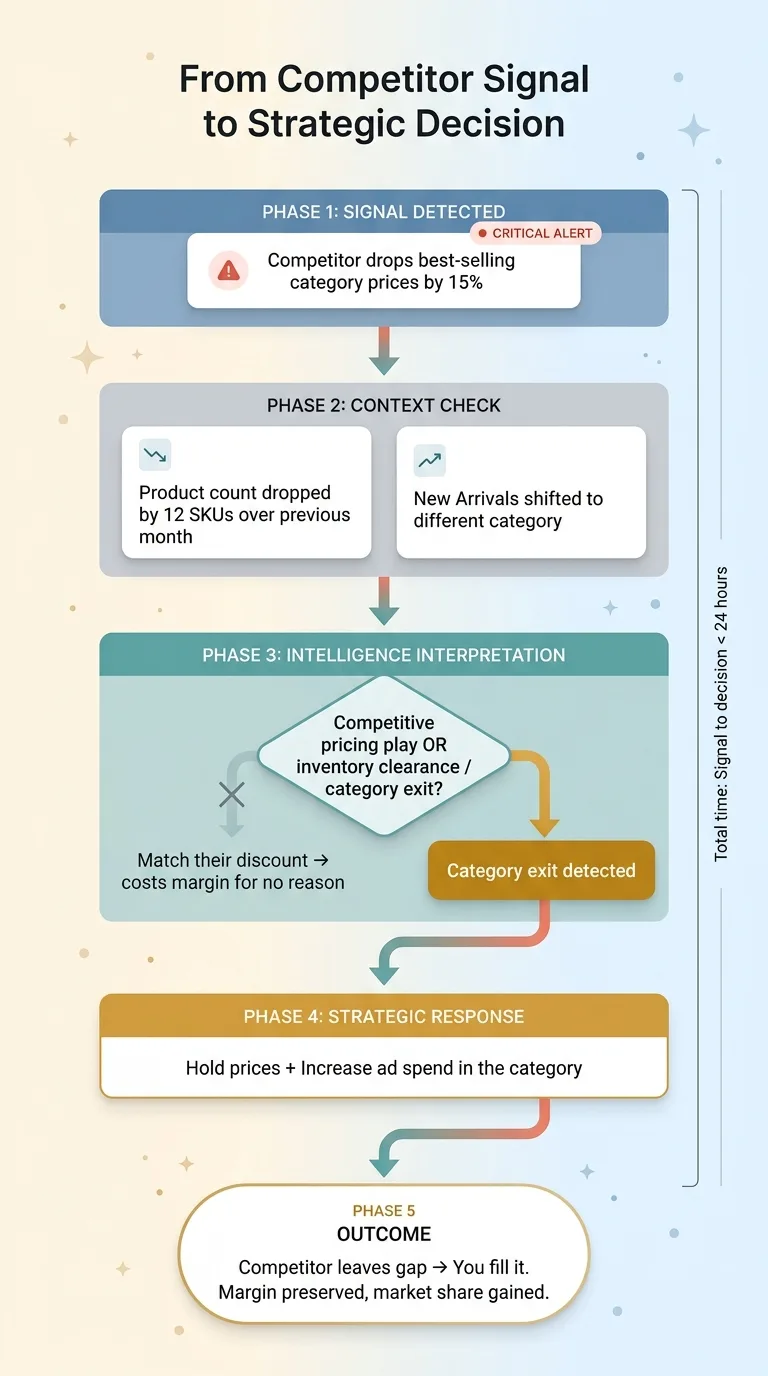 Intelligence-to-Decision Flowchart
I checked two additional signals from the same scan. Their product count in that category had dropped by 12 SKUs over the previous month, and their "New Arrivals" page had shifted toward a completely different product category. This wasn't a competitive pricing play. They were clearing inventory to exit the category.
That changes the response completely. Instead of matching their discount (which would have cost me margin for no reason), I held my prices and increased ad spend in that category. They were leaving a gap. I filled it.
Another example: tracking review sentiment across all 7 competitors revealed that 3 of them had recurring complaints about sizing inconsistency. That became a positioning opportunity. I added sizing guarantee messaging to my product pages and saw conversion improve on those specific categories within two weeks.
The intelligence from this system feeds directly into my AI-powered dynamic pricing system, which adjusts prices across 564+ products using a 4-tier ABC classification. Competitor pricing data is one of the key inputs. Without automated competitive intelligence, the pricing engine would be working with stale data.
What Surprised Me After 90 Days of Automated Monitoring
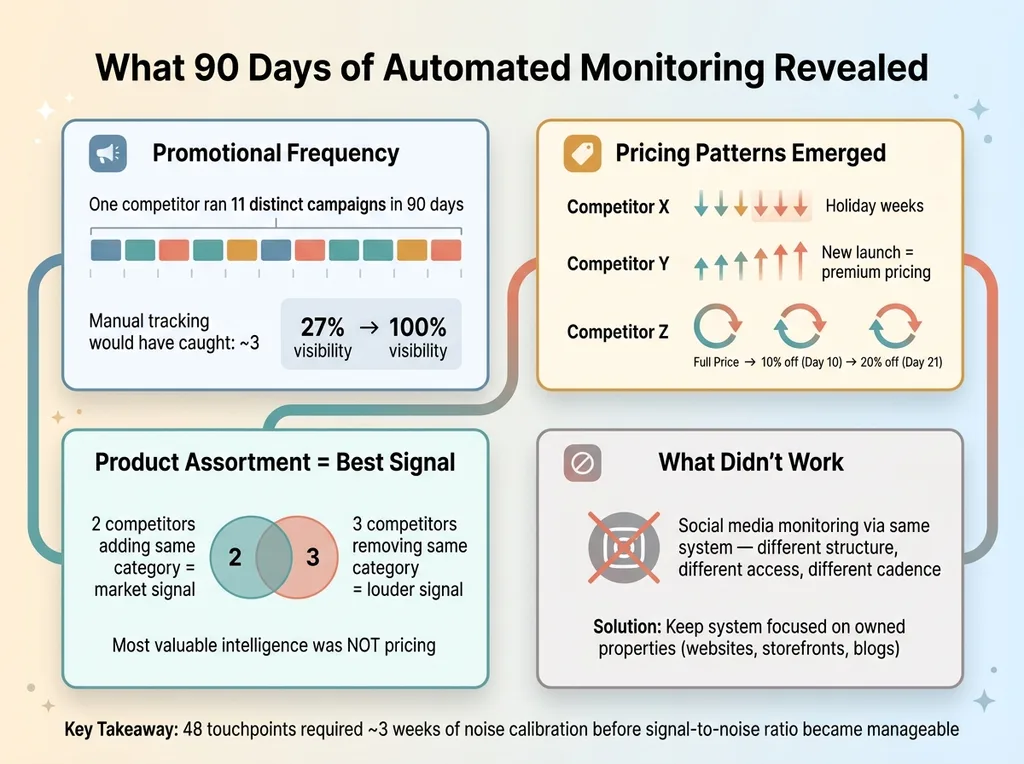
Competitors change promotions far more often than I assumed. One brand ran 11 different promotional offers in 90 days. Not 11 variations of the same sale — 11 distinct campaigns with different discount structures, different featured products, different messaging. Manually, I would have caught maybe 3 of those. The automated system caught all 11, and the patterns revealed their promotional calendar. Now I can anticipate their next move.
 90-Day Pattern Discovery
Pricing changes are seasonal and predictable once you have enough data. After 90 days of daily price tracking, clear patterns emerged. Competitor X drops prices the week before every major holiday. Competitor Y raises prices when they launch new products (using the new launch as justification for premium positioning). Competitor Z runs a predictable 3-week cycle: new collection launch at full price, 10% off after 10 days, 20% off after 21 days. Once you see the pattern, you can plan around it instead of reacting to it.
The most valuable intelligence wasn't pricing — it was product assortment changes. Watching what competitors add and remove from their catalogs tells you where the market is heading before the trend becomes obvious. Two competitors adding the same product category within a month of each other is a signal. Three competitors removing the same category is a louder one.
What didn't work: trying to monitor social media through the same system. Social platforms have different structures, different access limitations, and different cadences. Firecrawl excels at owned properties — websites, storefronts, blogs. I kept the system focused there and use separate tools for social monitoring.
I'll also be honest that 48 touchpoints generates a lot of noise, especially in the first month. I was over-reacting to every minor change — a competitor updated their About page copy and I spent an hour analyzing it. The system needed tuning. I added severity thresholds and change-frequency filters that took about three weeks to calibrate. Now the signal-to-noise ratio is manageable.
Building This for Your Business: What You Need
The Minimum Viable Competitive Intelligence Stack
You don't need 48 touchpoints on day one. Start here:
- Identify your top 5-7 competitors. Not aspirational competitors you wish you competed with. Actual competitors bidding on the same keywords and selling to the same customers.
- Define 20-30 touchpoints that matter for your industry. A SaaS company cares about pricing page changes and feature comparison updates. A restaurant group cares about menu changes and review sentiment. Pick the signals that predict moves in your specific market.
- Set up Firecrawl or a similar scanning tool. Firecrawl's API pricing is reasonable for this scale. You don't need an enterprise contract.
- Build the comparison layer in Python. This isn't complex code. It's mostly string comparison, numerical change detection, and timestamp logging. A solid developer can build it in a week.
- Create a simple report or dashboard. Start with a weekly email digest. Get fancier later.
Total cost for this stack: well under $500/month including API fees and server costs. Compare that to enterprise competitive intelligence platforms charging $20K-$50K per year that still require manual interpretation on the back end.
When It Makes Sense to Build vs. Buy
Build when: you're in a market with 5+ meaningful competitors, your margins are sensitive to pricing moves, and competitive shifts happen frequently. DTC, SaaS, real estate, financial services — these are all markets where automated competitor monitoring pays for itself in weeks.
Don't build when: you have 1-2 competitors and can realistically check their sites in 20 minutes each week. Not every business needs this level of automation. Be honest about the ROI before you invest the engineering time.
The real value multiplier comes when competitive intelligence connects to your other systems. In my business, the competitor data feeds into pricing, content strategy, and product development. It's one of 14 skills I've built into my AI ecommerce platform, and it becomes exponentially more valuable when it's not operating in isolation.
If you're running a DTC brand and want to see how competitive intelligence fits into the broader picture — alongside automated content, dynamic pricing, and product pipeline acceleration — I wrote a full breakdown in my AI playbook for DTC brands.
Want to Know What Your Competitors Are Doing While You're Not Watching?
I built this system because I was tired of finding out about competitor moves a week too late. Now I find out within 24 hours and have the context to decide whether to respond, ignore, or capitalize.
If you're running a business where competitive positioning matters — and you know your current approach is some mix of "check when I remember" and "hope nothing changes" — this is a solvable problem. The technical barrier is lower than you think. The strategic value is higher than you'd expect.
I help companies design and build exactly these kinds of systems. Not generic dashboards. Custom intelligence pipelines that connect to the decisions you actually make every week.
Book a free 30-minute strategy call. No pitch deck, no sales team. Just a real conversation about your competitive landscape and whether automated intelligence makes sense for your business. If it doesn't, I'll tell you that too.
Get AI insights for business leaders
Practical AI strategy from someone who built the systems — not just studied them. No spam, no fluff.
Hodgen.AI
Ready to automate your growth?
Book a free 30-minute strategy call with Hodgen.AI.
Book a Strategy Call