How AI Scores Manufacturing Difficulty to Set Prices
AI manufacturing pricing that scores garment difficulty, fabric complexity, and supplier costs. How I replaced gut-feel pricing with data.
By Mike Hodgen
Why I Stopped Guessing What Things Cost to Make
I run a DTC fashion brand in San Diego. Handmade garments, 564+ active SKUs, multiple garment types, dozens of fabric combinations, and a handful of suppliers with very different capabilities. At that scale, AI manufacturing pricing isn't a nice-to-have. It's the difference between knowing your margins and hoping they exist.
The breaking point came when I pulled quarterly numbers and found a wrap dress that had been one of our best sellers by volume — and one of our worst performers by margin. The fabric looked affordable per yard. The construction seemed straightforward. But the reality was different: the drape of the fabric required slower cutting, the wrap construction had hidden finishing complexity, and the supplier we'd assigned it to had a defect rate on that garment type that was eating into every batch. We'd priced it based on competitor comparables plus a standard markup. We were wrong by 23%.
That's the old method. Look at what similar products sell for. Add your markup. Hope the math works out when the invoices come in.
The new method: score every product's manufacturing difficulty algorithmically and price from actual production cost up. Then validate that price against market data — not the other way around.
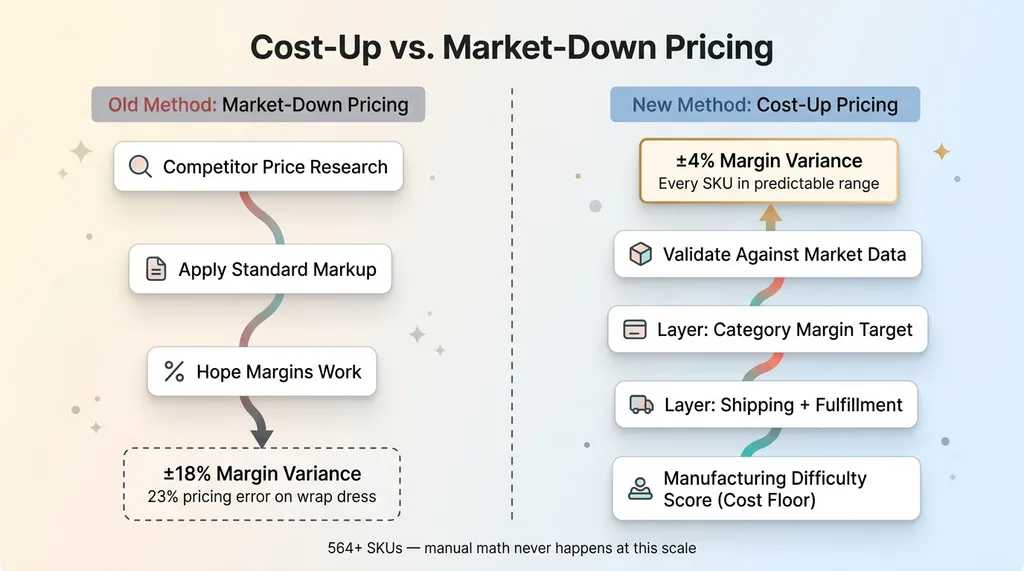
Most brands price from the market down. They find a price the customer will pay and back into margins they can live with. The brands that survive long-term price from cost up and then check whether the market supports it. If it doesn't, that's a product design problem, not a pricing problem. The manufacturing difficulty scoring system I built is what makes cost-up pricing possible at scale. It's one skill within the broader AI platform I've built, and it changed how I think about every product in the catalog.
The Three Layers of Manufacturing Difficulty Scoring
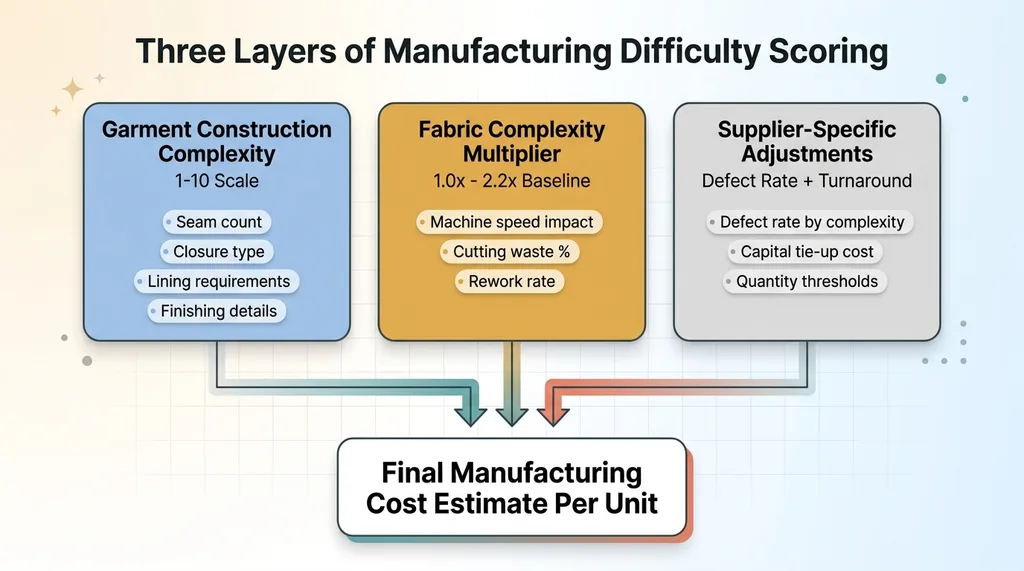
Manufacturing difficulty scoring breaks down into three distinct layers. Each one captures a different source of cost variability. Miss any one of them and your cost estimates drift. Miss two and you're flying blind.
 Three Layers of Manufacturing Difficulty Scoring
Garment Construction Complexity
This is the biggest variable, especially for handmade goods where labor is the dominant cost driver.
The system scores garment construction on a 1-10 scale based on measurable structural elements: number of seams, closure type (zippers vs. buttons vs. ties vs. hooks), lining requirements, structural elements like boning or interfacing, and finishing details — rolled hems vs. raw edges vs. bound seams vs. hand-stitched elements.
A basic tank top with clean-finished edges scores around 2/10. Minimal seams, no closures, simple hem. A fully lined blazer with welt pockets, structured shoulders, and a custom button closure scores 8/10. Each point on the scale maps to a labor-time estimate derived from actual production logs. The difference between a 2 and an 8 isn't abstract — it's roughly 35 minutes of additional skilled labor per unit in my production data.
The scoring accounts for compound complexity too. A garment with three moderately difficult features often takes longer than one with a single very difficult feature, because the maker has to switch techniques and tools repeatedly. The algorithm weights cumulative complexity, not just peak difficulty.
Fabric Complexity Multipliers
Not all fabrics sew the same, and the cost difference is dramatic.
 Fabric Complexity Multiplier Scale
Silk charmeuse requires slower machine speeds, specialized needles, and generates more waste from cutting errors because the fabric shifts. Knits stretch during handling and need different seam types — serged or coverstitch instead of straight stitch. Heavyweight canvas dulls needles faster and requires industrial equipment.
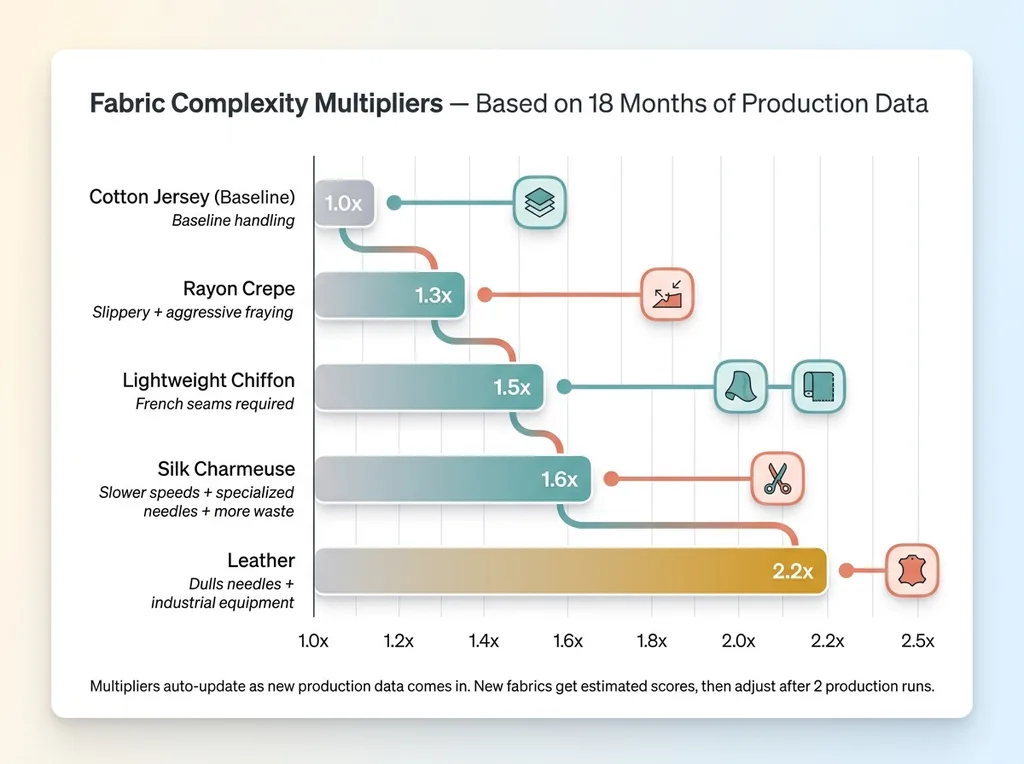
The system scores fabrics on a multiplier scale where basic cotton jersey is the 1.0x baseline. Silk charmeuse runs 1.6x. Leather sits at 2.2x. Rayon crepe — which is slippery and frays aggressively — comes in at 1.3x. Lightweight chiffon, which requires French seams to avoid visible seam allowances, scores 1.5x.
These multipliers aren't theoretical. They come from analyzing actual production data — cutting waste percentages, time-per-unit differences, and rework rates across fabric types over 18 months of production. The production cost AI updates these multipliers as new data comes in. When a new fabric enters the line, it gets an estimated multiplier based on its physical characteristics, then adjusts after the first two production runs give us real numbers.
Supplier-Specific Adjustments
This layer catches what the other two miss.
Different makers have different minimums, different per-unit costs at varying quantities, different turnaround times, and — critically — different defect rates. A supplier quoting $18 per unit with a 4% defect rate effectively costs $18.75 per unit when you account for replacements and quality control time. A supplier quoting $20 per unit with a 0.5% defect rate is actually cheaper on complex garments.
The system also factors in turnaround time as a cost. A supplier who takes three weeks longer ties up capital and delays revenue. That has a calculable cost that most spreadsheet models ignore entirely.
The AI aggregates all three layers — construction score, fabric multiplier, and supplier adjustment — into a final manufacturing cost estimate per unit. That estimate becomes the foundation for everything downstream.
How the Scoring Algorithm Actually Works
Input Data Points
For each product, the system ingests: garment type classification, construction specification (either from a tech pack or parsed from product description and reference images), primary and secondary fabric types, fabric weight, supplier ID, and projected order quantity.
During the product creation pipeline, the difficulty score gets calculated before a single stitch is sewn. That means pricing is informed by manufacturing reality at the concept stage, not discovered after the first invoice arrives.
The Weighted Formula
The algorithm isn't a black box. It's a weighted scoring model I can explain, audit, and override when I know something it doesn't.
 Weighted Formula Breakdown
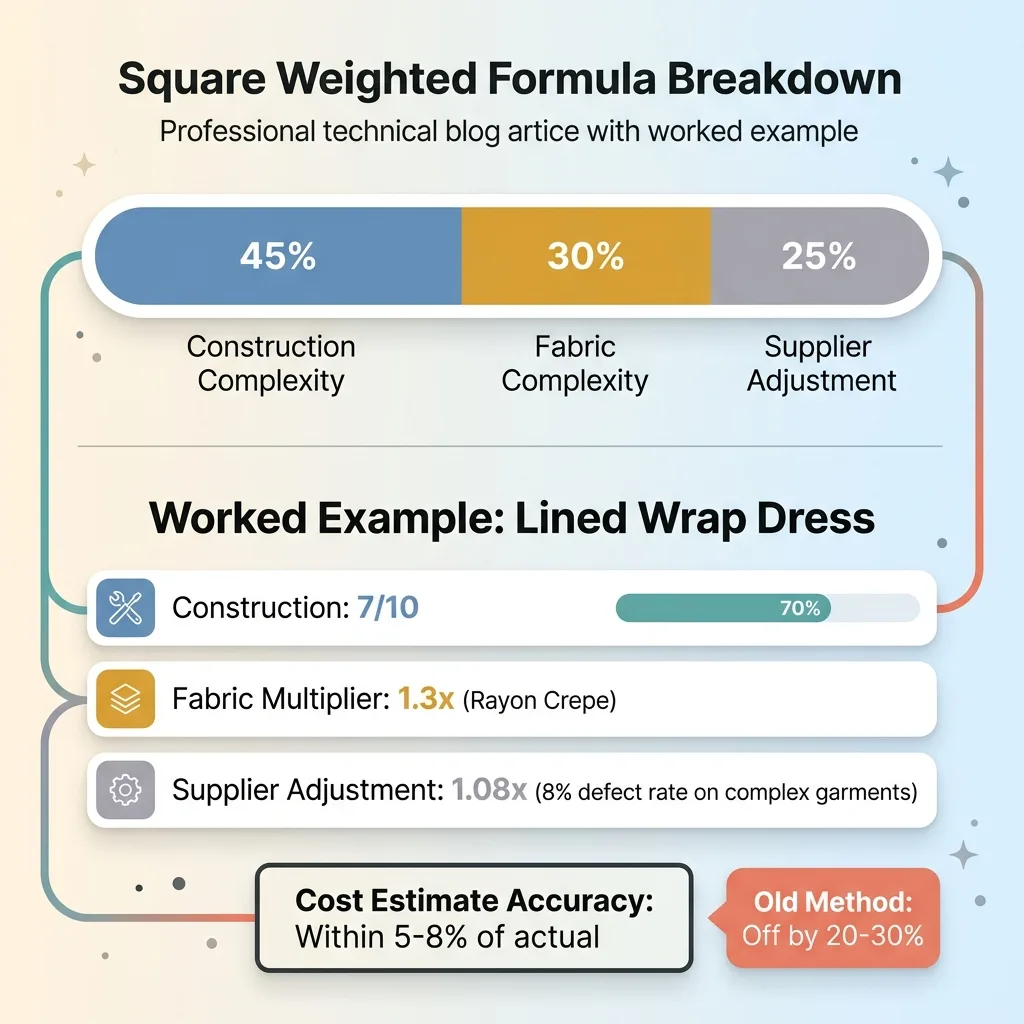
Construction complexity carries the heaviest weight — 45% of the final score. For handmade goods, labor is the single biggest variable. The difference between a simple and complex garment can be 3x in labor hours, while fabric cost might only vary 1.5x.
Fabric complexity multiplier is next at 30%. Material cost and waste rates vary dramatically — I've seen waste rates range from 6% on basic woven cotton to 22% on printed silk with pattern matching requirements. That's not a rounding error.
Supplier adjustment gets 25%. It's the smallest weight but it catches things the other two layers miss entirely — defect rates that spike on specific garment types, cash flow impact from slow turnaround, and quantity discount thresholds that change the unit economics.
Here's a simplified example: Product X is a lined wrap dress. Construction scores 7/10 — the lining, wrap closure, and bound internal seams add significant labor. Fabric is rayon crepe at a 1.3x multiplier. Supplier B carries a 1.08x adjustment based on an 8% historical defect rate on garments scoring above 6 in complexity.
The system combines these into a cost estimate that, across the catalog, lands within 5-8% of actual production cost. The old method — competitor-based markup — was routinely off by 20-30%. That's the difference between managing margins and discovering them after the fact.
From Difficulty Score to Retail Price
The manufacturing difficulty score gives you a floor. Below this price, you lose money. Full stop.
 Cost-Up vs. Market-Down Pricing
From that floor, the system layers on: shipping and fulfillment costs (scored by product weight and packed dimensions), target margin by product category (basics run thinner margins because they're volume plays; statement pieces carry higher margin because they sell on design, not price comparison), and market positioning data.
The cost side — everything in this article — feeds into the AI dynamic pricing system that handles the demand side. Together they create a pricing envelope. The floor is manufacturing cost plus minimum acceptable margin. The ceiling is what the market data says customers will pay. The AI recommends a price within that envelope, weighted by inventory levels, sell-through velocity, and seasonal demand patterns.
The result that matters most: after implementing this system, margin variance across the catalog dropped from ±18% to ±4%.
Think about what ±18% variance means in practice. It means some products are making you good money and others are quietly losing money, and you can't tell which is which without pulling invoices and doing manual math on every SKU. At 564+ products, that manual math never happens. You just average it out and hope the winners cover the losers.
At ±4% variance, every product in the catalog is performing within a predictable range. No hidden losers. No margin surprises at quarter-end.
What This Caught That Spreadsheets Missed
Three specific discoveries, all from real production data.
 Three Hidden Cost Discoveries
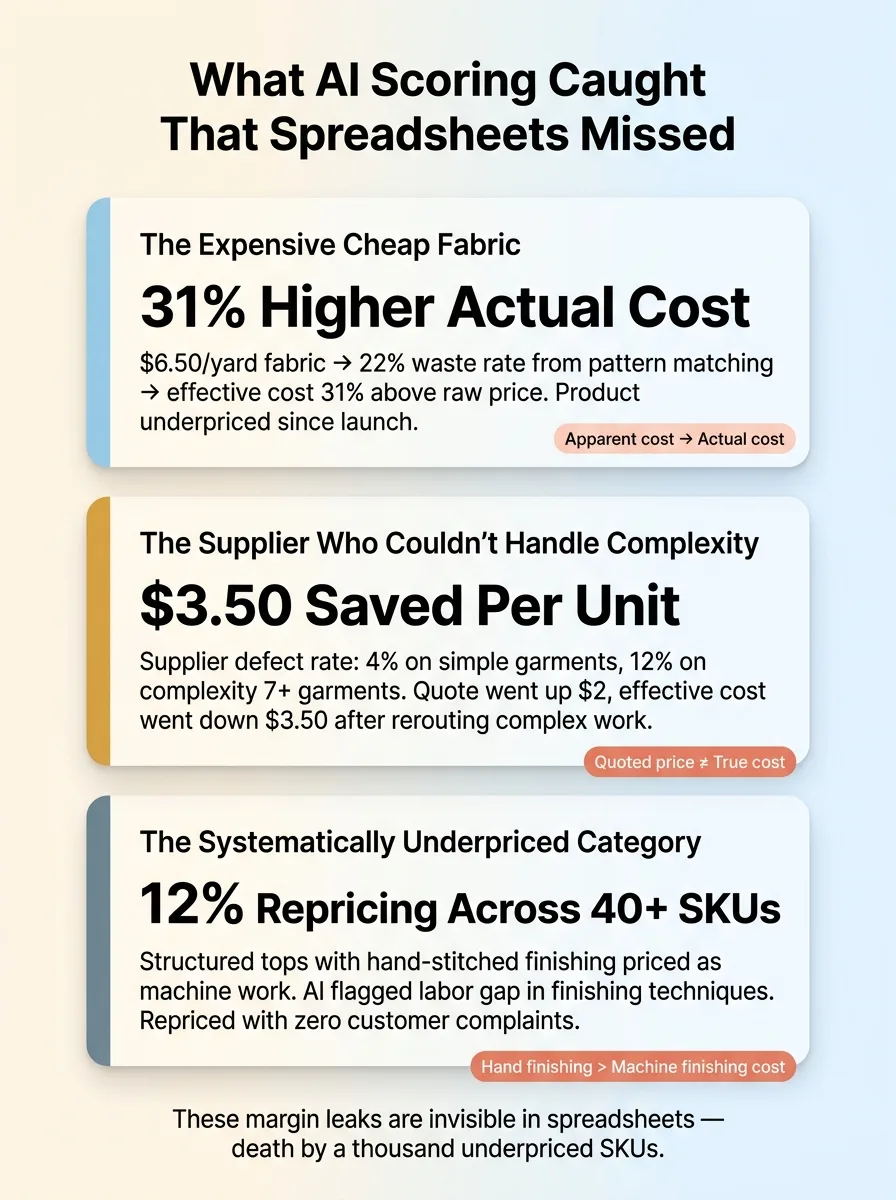
The expensive "cheap" fabric. A fabric that looked affordable at $6.50 per yard had a 22% waste rate during cutting because of its pattern repeat. The print required careful matching at seams, which meant more fabric per garment and slower cutting. The fabric complexity multiplier caught this after analyzing two production runs. Effective cost per garment was 31% higher than the raw yardage price suggested. That product had been underpriced since launch.
The supplier who couldn't handle complexity. One supplier's quoted prices were consistently competitive. But when the system correlated defect rates with garment construction scores, a clear pattern emerged: their defect rate on garments scoring 7+ in construction complexity was triple their rate on simple garments (12% vs. 4%). They were great at basics and terrible at anything requiring precision finishing. The supplier-specific adjustment exposed this, and I rerouted complex garments to a different maker. Cost per unit went up $2 on the quote but down $3.50 when you accounted for defects and rework.
The systematically underpriced category. An entire product category — structured tops with internal facing and topstitching — was underpriced by 12% across the board. The garment manufacturing cost analysis revealed that the hand-stitched finishing details were being priced as if they were machine work. The construction scoring model flagged the labor gap because it weights finishing techniques independently from the main assembly. That 12% repricing across 40+ SKUs added meaningful margin without a single customer complaint — the prices were still competitive, just no longer below cost.
These aren't hypothetical scenarios. These are the kinds of margin leaks that kill DTC brands slowly — death by a thousand underpriced SKUs.
Building This Without a Data Science Team
The MOFU objection I hear most often: "This sounds great but I'd need to hire three data scientists."
You don't. This system runs as part of my broader AI platform — Python scripts that pull from existing production data. No dedicated ML infrastructure. No data lake. No team of PhDs.
The initial scoring model was built by analyzing 18 months of actual production invoices, defect reports, and fabric purchase orders I already had sitting in spreadsheets and email. The AI parsed those documents, identified cost patterns across garment types and suppliers, and proposed initial weights for each scoring layer. I tuned the weights manually based on my knowledge of garment construction — where the algorithm's estimates diverged from what I knew about how things actually get made.
Total build time for the first working version: about a week. It was rough. The fabric complexity multipliers were too conservative and the supplier adjustments didn't account for complexity-dependent defect rates yet. But even the V1 was more accurate than the spreadsheet it replaced.
Ongoing maintenance: the system recalibrates quarterly when I feed it updated production data. About two hours of my time per quarter.
You don't need a data science team. You need someone who understands both the manufacturing domain and the AI tooling well enough to connect them. That intersection is rare, but it's exactly where a Chief AI Officer operates.
What Cost-Blind Pricing Is Costing Your Business
Most businesses — not just fashion — price based on market comparables or historical markups. That works until a supplier raises prices 15%. Until material costs shift. Until your most popular product turns out to be your least profitable.
Manufacturing difficulty scoring isn't fashion-specific. Any business that makes or assembles physical products has the same three layers: labor complexity that varies by product, material variability that affects waste and handling cost, and supplier reliability that creates hidden cost variance.
A custom furniture maker has construction complexity in joinery types and material complexity in wood species. A food manufacturer has production complexity in recipes and ingredient variability in seasonal sourcing. The framework translates.
The AI infrastructure to score and price from cost up is buildable in weeks, not months. The data you need — production invoices, material costs, defect logs — almost certainly already exists in your business. It's just not connected to your pricing decisions.
If you're running a business where you can't instantly answer "what does this specific product actually cost me to produce?" — that's the gap. And it's a gap that widens every time you add a SKU, change a supplier, or adjust a material.
Want to Know What Your Products Actually Cost?
I do a free 30-minute strategy call where we look at your operations and figure out whether AI-driven manufacturing pricing — or any other operational AI — makes sense for your business. No pitch deck. No sales team. Just a real conversation about where you're leaking margin and what's buildable.
Or if you want to see how this fits into the bigger picture of what AI can do for your operations, start there.
Get AI insights for business leaders
Practical AI strategy from someone who built the systems — not just studied them. No spam, no fluff.
Hodgen.AI
Ready to automate your growth?
Book a free 30-minute strategy call with Hodgen.AI.
Book a Strategy Call