Profit on Ad Spend vs ROAS: The Metric That Actually Pays
ROAS told my ad bot a 1.5x return was a win. At my margins it was a loss. Here's profit on ad spend vs ROAS and the metric that actually matters.
By Mike Hodgen
Your Ads Show a 'Good' ROAS and You're Still Not Making Money
Here's a problem that cost me real money before I caught it. My ad dashboard was lit up green, and I was still losing money. If you've ever stared at a "winning" ad set and wondered why your bank balance didn't agree, this is the profit on ad spend vs ROAS gap, and it's quietly bleeding most DTC brands dry.
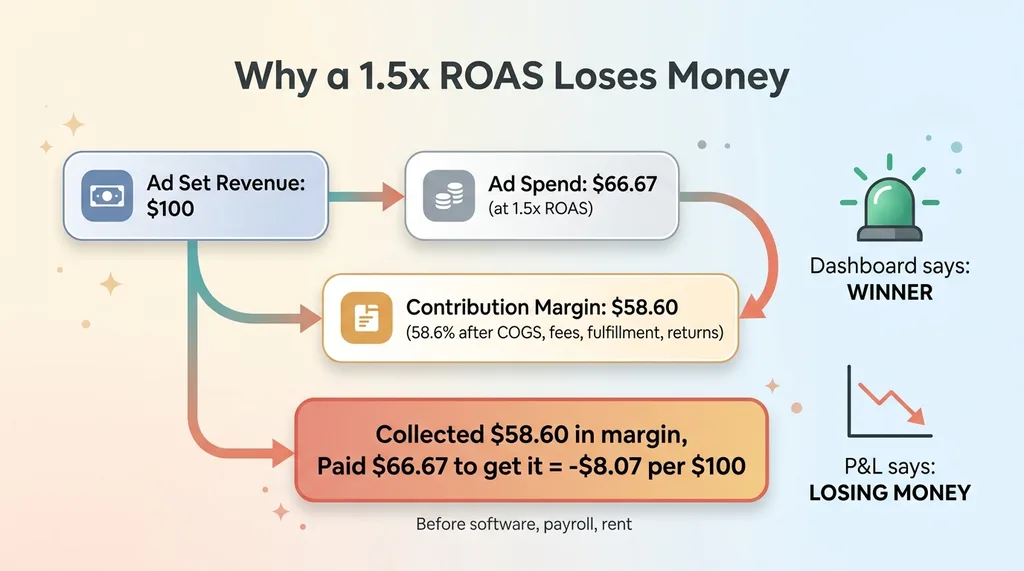 The $100 ad set losing money despite a 'green' ROAS
Let me show you exactly how it bit me.
A DTC fashion brand I run in San Diego had ad sets reporting a 1.5x ROAS. The platform called those green. Winners. Scale them.
But my contribution margin on those products was 58.6%. And at 58.6% margin, my break-even ROAS is 1.71x. So every "winning" ad set sitting at 1.5x was actually losing money on every order.
Run the math and it stops being abstract.
Say an ad set generates $100 in revenue at a 1.5x ROAS. That means I spent $66.67 to get it. But of that $100 in revenue, only $58.60 is contribution margin (after cost of goods, payment fees, fulfillment, returns).
So I collected $58.60 in real margin and paid $66.67 to get it. I'm $8 underwater per $100, and that's before I've paid for software, payroll, rent, or anything else that keeps the lights on.
The dashboard said winner. The P&L said you're paying customers to buy from you.
The root problem is simple: ROAS treats revenue as the goal. Revenue is not profit. ROAS doesn't know your margins, doesn't know your break-even, and doesn't care.
So I rebuilt my ad autopilot to optimize profit on ad spend (POAS), not ROAS. Same automation I'd already built when I collapsed three ad systems into one, but now the decisions are anchored to actual profit instead of top-line revenue.
That one change moved the brand from "looks profitable" to "is profitable." Here's how it works.
Why ROAS Lies: It Doesn't Know Your Margins
ROAS is revenue divided by ad spend. That's the entire formula. Notice what's missing: any sense of what it costs you to make the product.
ROAS is margin-blind. Two products with an identical 3x ROAS can have opposite profit outcomes. One is a 70% margin item printing money. The other is a 30% margin item losing it. The ROAS number is the same. The reality is not.
The break-even ROAS formula
The number every ad decision should start with is your break-even ROAS, and it's almost embarrassingly simple:
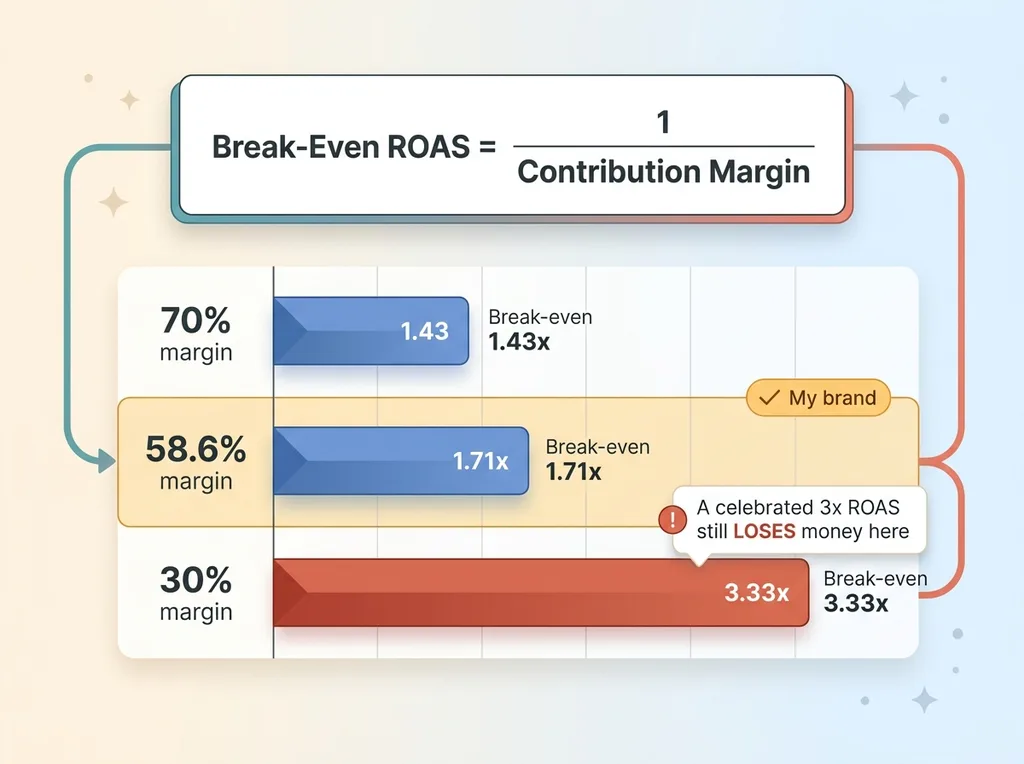 Break-even ROAS formula across different margins
Break-even ROAS = 1 / contribution margin
At my 58.6% contribution margin, that's 1 / 0.586 = 1.71x. Below 1.71x, I lose money. Above it, I make money.
Now look at what happens with a thinner margin. At 30% contribution margin, break-even ROAS = 1 / 0.30 = 3.33x. You need to clear 3.33x just to not lose money on that product.
A brand selling 30% margin goods and celebrating a 3x ROAS is losing money on every order while the dashboard cheers.
Most ad automation never reads this number. It's not in the platform. It's not in the bidding. It just isn't there.
Why blended ROAS hides the bleeding
Blended ROAS is where this gets dangerous, because it looks reassuring.
You can post a "healthy" 2.5x blended ROAS while a third of your catalog is selling below its own break-even. The high-margin winners subsidize the losers inside the average. Your top performers are carrying your worst ones, and the blended number papers over the whole mess.
The dashboard looks fine. The bank account doesn't.
This is the trap: the more you scale the losers (because they look green at 1.5x), the worse your real profit gets, even as the blended average holds steady. You're scaling your way broke with a smile.
What Profit on Ad Spend (POAS) Actually Is
POAS flips the numerator. Instead of revenue divided by ad spend, it's contribution profit generated divided by ad spend.
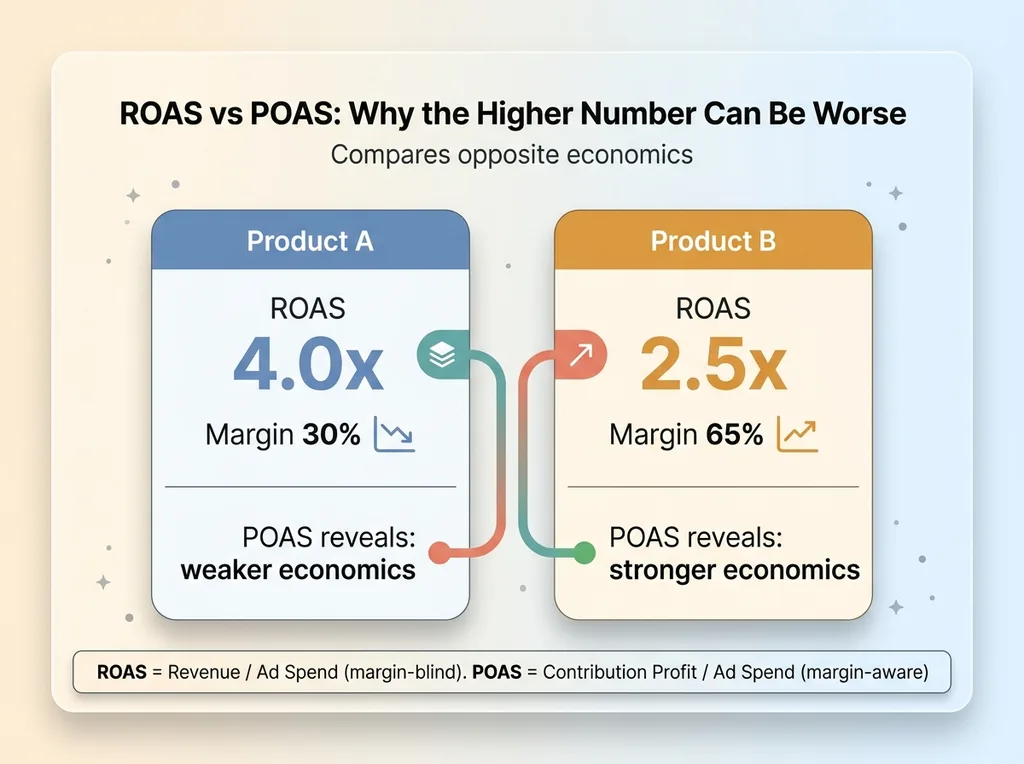 ROAS vs POAS, same headline, opposite economics
That single swap changes everything, because now the metric knows what your product actually costs you.
Let me be honest about contribution margin, because most people define it lazily. It's not just revenue minus COGS. Real contribution margin is revenue minus cost of goods, minus payment processing fees, minus fulfillment, minus a returns reserve. All of it. The stuff that actually leaves your account on every order.
Once you have that, POAS tells you the one thing ROAS can't: whether spending the next dollar makes you money.
Here's why this matters more than any ROAS target. A 4x ROAS on a 30% margin product can be worse than a 2.5x ROAS on a 65% margin product. The 4x has a higher headline number and worse economics. POAS catches that. ROAS celebrates the wrong one.
The only number that tells you whether to scale an ad set is profit per dollar of ad spend. Not revenue per dollar. Profit.
Now the honest limitation: POAS is only as good as your per-SKU margin data. If you don't know your true margin per product, you can't compute POAS, full stop. That's exactly why most brands default to ROAS. ROAS is easy to measure (the platform hands it to you). Profit is hard, because you have to know your real costs at the SKU level.
That's the work. And it's the work nobody wants to do, which is why it's worth doing.
How I Built the Margin-Aware Guardrail
The automation layer was already there. I'd built the agents that run my Meta ads, and they were making scaling decisions every day. The problem was they were making those decisions on ROAS. So I added a profit brain underneath them.
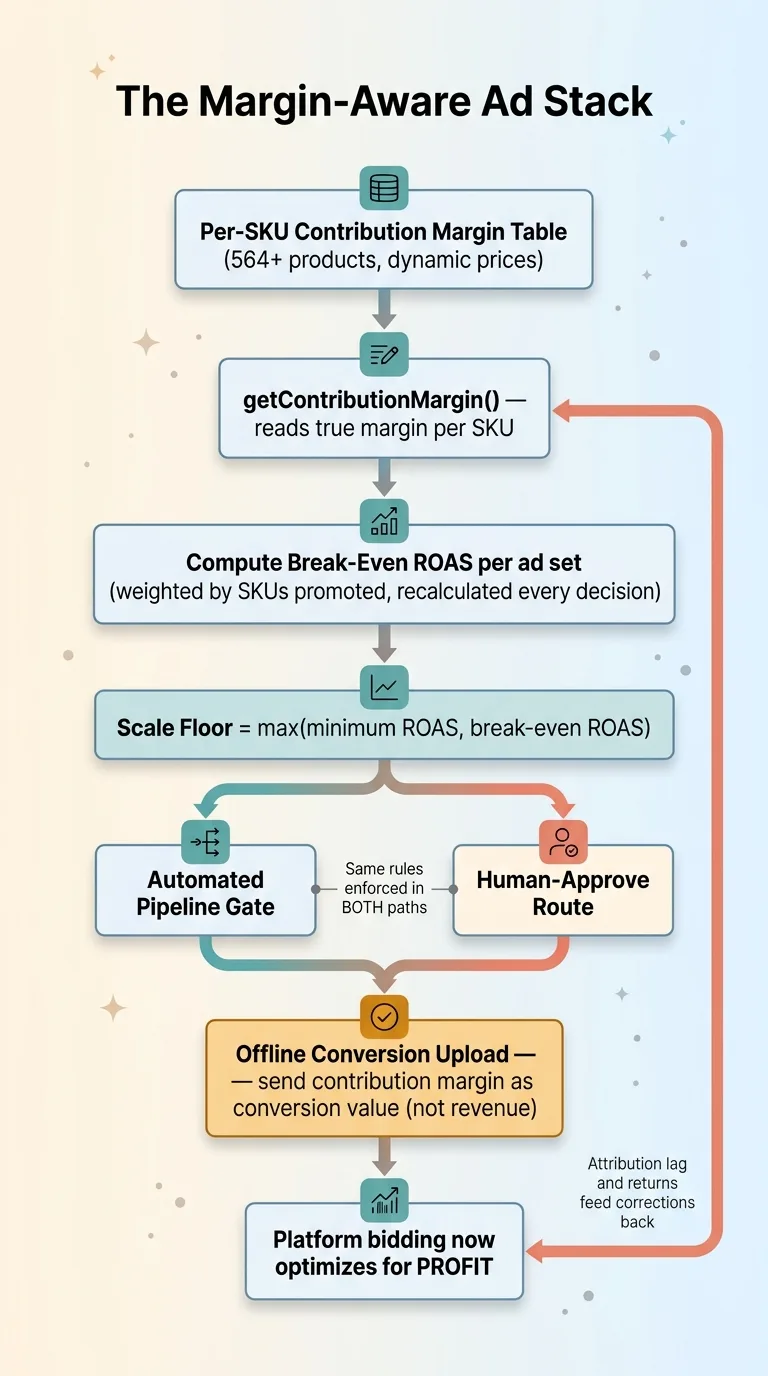 Margin-aware ad system architecture
Reading per-SKU contribution margin
I built a small profit module with a getContributionMargin() function that reads a per-SKU margin table. Every product has its true contribution margin stored and maintained, not guessed.
For each ad set, the system computes the break-even ROAS from the weighted margin of the specific SKUs that ad set promotes. An ad set pushing high-margin items gets a low break-even bar. One pushing thin-margin items gets a high one. The floor is specific to what's actually being sold.
The scale floor that can't be crossed
Then I set the scaling floor to max(minimum ROAS, break-even ROAS). The autopilot is now structurally incapable of scaling an ad set below break-even. It can't do it. The decision path won't allow it.
This is the part most people get wrong: I enforced this in both places decisions get made. The fully automated pipeline gate, and the human-approve route where I sign off manually.
A guardrail that only lives in one path isn't a guardrail. If the automated route protects break-even but the human route doesn't, you've just moved the leak. I build human checkpoints into my systems on purpose, but the checkpoint has to carry the same rules as the automation, or it's theater.
One more detail that matters at scale. I have 564+ products with prices that move dynamically. When prices change, margins change. So the break-even floor isn't a static number I set once and forget. It recalculates from current margins every time a decision is made. A floor based on last quarter's margins is a floor that's already wrong.
Break-Even Isn't the Bar for Scaling, Add a Target ROAS
Here's the nuance that separates this from generic "track your margins" advice.
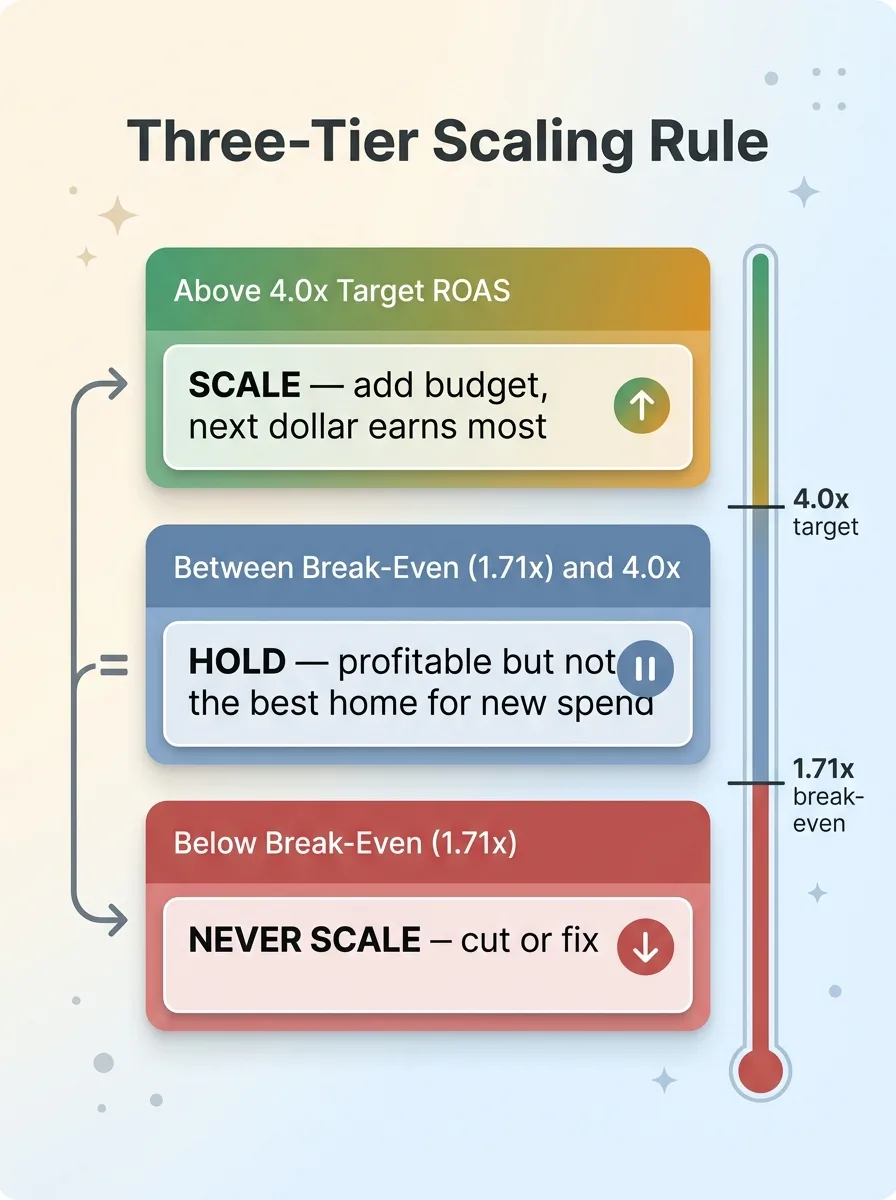 Three-tier scaling decision rules
Not losing money is the floor. It is not the goal. Break-even is where you stop digging, not where you start scaling.
So I added a separate, higher efficiency target: a target ROAS of 4.0x as the actual bar for pouring in more spend. Three tiers, three actions:
- Above 4.0x: scale. Add budget. This is where the next dollar earns the most.
- Between break-even and 4.0x: hold. Don't kill it, don't feed it. It's profitable but it's not the best home for new spend.
- Below break-even: never scale. Cut or fix.
The reason for the hold tier matters. Picture a 2.0x ad set. It's technically profitable (above my 1.71x break-even). The naive move is to scale it because it's "winning." But pouring budget into a 2.0x ad set dilutes my blended performance and eats budget that a 5x ad set could turn into far more profit.
A profitable-but-marginal ad set is a fine place to leave money. It's a bad place to add money.
And here's the ranking rule that ties it together: I rank scaling decisions by efficiency (POAS rate), not raw profit-dollar volume.
A high-volume, low-efficiency ad set looks like a big winner when you sort by total profit dollars. It's generating the most absolute profit, so it grabs attention. But it's a bad place to add the next dollar, because each new dollar earns less there than it would in a smaller, higher-efficiency ad set. Total dollars tell you what's working today. Efficiency tells you where tomorrow's dollar should go.
Letting the Ad Platform Optimize for Profit, Not Revenue
The guardrails control what my system scales. But the ad platform's own bidding algorithm is making thousands of micro-decisions I never see, and by default it's optimizing for the wrong thing.
So I added the last layer: margin-as-conversion-value through offline conversion upload.
Normally you send the platform the order revenue as the conversion value. The algorithm then learns to find more high-revenue orders. Which sounds good until you remember revenue isn't profit.
Instead, I send the contribution margin of each order as the conversion value. Now the platform's bidding optimizes for contribution profit, not top-line revenue. A $200 order at 25% margin reports a $50 value. A $120 order at 65% margin reports a $78 value. The algorithm starts chasing the second one.
This means the bidding itself stops favoring high-revenue, low-margin orders. The machine learning that I can't directly control is now pulling in the right direction, because I changed what "good" means to it.
Let me be honest about what's hard here, because this is not set-and-forget.
Attribution lag is real. The platform doesn't see the margin instantly. Returns reverse margin after the fact, so an order that reported $78 of margin can become a return that wipes it out, and you have to feed that correction back. And the whole thing only works if your margin data going up is accurate. Garbage margin in, garbage bidding out.
The result I'll frame honestly, without inventing numbers: the decisions changed. The bot stopped scaling things that looked good on revenue and started holding the line on real profit. That's the win. Not a magic multiplier, a system that finally spends money the way I would if I had time to inspect every ad set by hand.
The Metric Your Ad Bot Should Be Optimizing
If your ads show a good ROAS and you're still not making money, the answer is almost always the same: nothing in your stack knows your margins.
Not your dashboard. Not your automation. Not the platform's bidding. They're all optimizing a number that literally cannot tell profit from loss, because the formula doesn't include cost.
The fix isn't a new ad tool. It's not switching agencies or buying the expensive platform. It's connecting per-SKU contribution margin to the one decision that actually spends your money. That's it. That's the missing wire.
Most ad automation, including the expensive kind, never makes that connection. It reports ROAS, optimizes ROAS, and celebrates ROAS, while a third of your catalog quietly loses money under a healthy-looking blended average.
This is the kind of work I do. I don't just advise on it from a slide deck. I build the actual margin tables, the break-even guardrails, the offline conversion uploads, and the bidding logic into systems that run a real brand. Mine. And because I track ROI obsessively, I know which of these changes paid off and which didn't.
If your ad spend is growing and your profit isn't, that gap is usually one missing metric. Profit on ad spend instead of ROAS. The work is connecting it to the thing that spends the money.
Ready to bring AI leadership into your company?
I work with a small number of companies at a time. If you're serious about AI, apply to work together and I'll review your application personally.
Get AI insights for business leaders
Practical AI strategy from someone who built the systems — not just studied them. No spam, no fluff.
Hodgen.AI
Ready to automate your growth?
Book a free 30-minute strategy call with Hodgen.AI.
Book a Strategy Call