True Blended ROAS: Why No Tool Shows Your Real Profit
Shopify, Meta, Google, and QuickBooks each show a different number. Here is how I built a true blended ROAS view for my DTC brand to find real profit.
By Mike Hodgen
Four Tools, Four Different Numbers, Zero Truth
Last month I sat down to answer one simple question about the DTC fashion brand I run in San Diego: did we actually make money?
 The four-tabs problem, fragmented numbers, no single truth
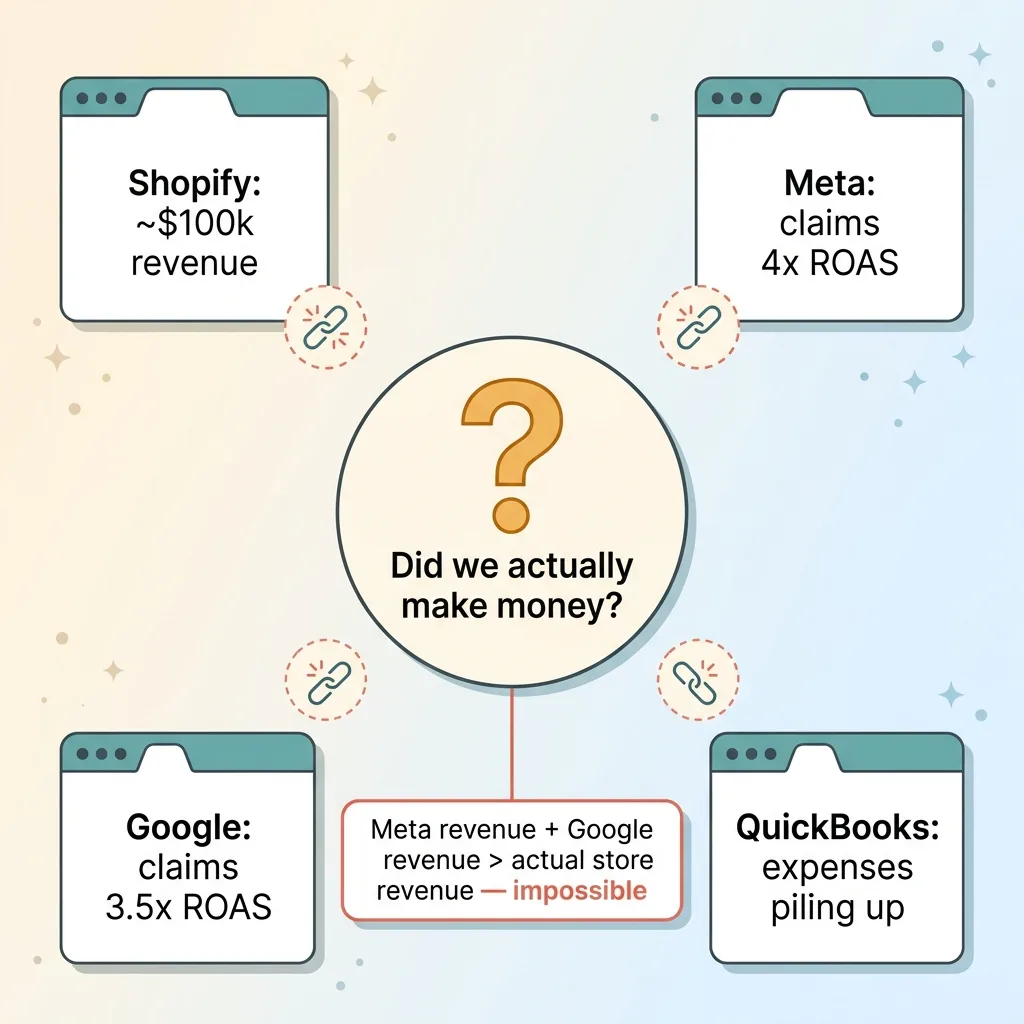
I opened four tabs. Shopify said we did about $100k in revenue. Meta's dashboard claimed it drove a 4x ROAS. Google's dashboard claimed 3.5x. QuickBooks showed the expenses piling up underneath all of it.
Then I did the math that breaks every DTC owner's brain. I added up the revenue Meta said it drove plus the revenue Google said it drove. The total was higher than my actual store revenue.
That is impossible. The ad platforms were collectively taking credit for more sales than my store actually made. But that is exactly what every one of us stares at every month.
Here is what bothered me most. Not one of those four tabs showed me the number I actually needed. Revenue, minus all my ad spend, minus the real cost of running the business. That single figure, my true blended profit, was nowhere on the screen.
Each tool was technically correct inside its own walls. Shopify knew my revenue. Meta knew what I spent on Meta. Google knew what I spent on Google. QuickBooks knew my bills. But none of them talked to each other, and the two that talked the loudest, the ad platforms, were grading their own homework.
The honest version of true blended ROAS for ecommerce does not live in any one of those dashboards. It lives in the space between them, in a number you have to assemble yourself. And until I built that, I was making five and six figure budget decisions on numbers that were structurally designed to flatter the tool reporting them.
So I went and built a blended finance view for my DTC brand. This is what I learned doing it.
Why Ad Platforms Inflate Their Own ROAS
This is not fraud. It is something more subtle and more dangerous: structural self-grading. Once you understand the mechanic, you stop trusting any single platform's revenue number ever again.
Attribution windows that overlap
Every ad platform reports the revenue it thinks it caused. To do that, it uses an attribution window. Meta might count a sale if someone clicked an ad in the last 7 days, or even just saw one in the last day without clicking. Google does the same thing with its own windows.
These windows are generous on purpose. A wider window means more sales the platform can claim, which means a better ROAS, which means you keep spending. The platform has no incentive to be conservative about what it takes credit for.
Both platforms claim the same sale
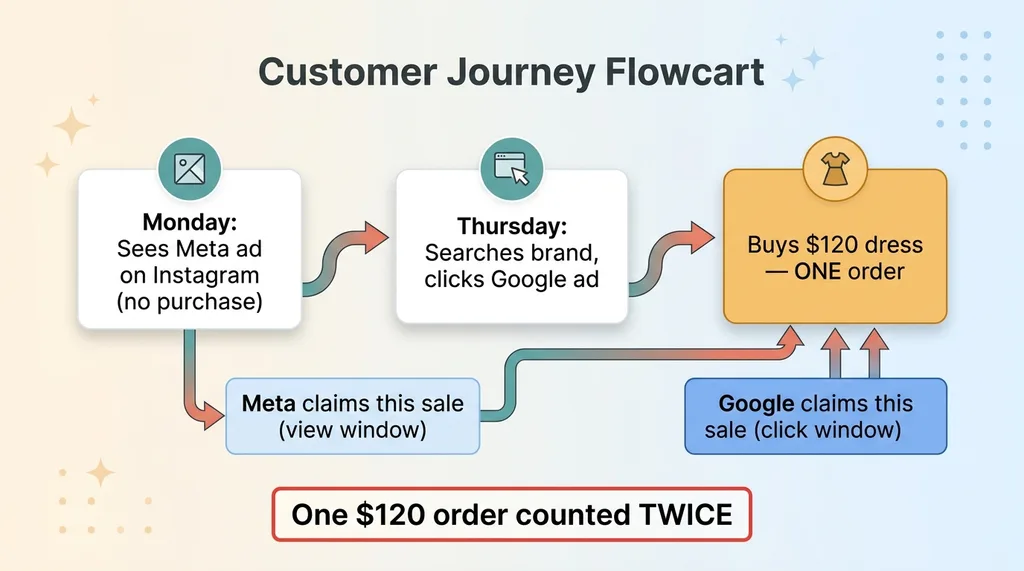
Now run a real customer through it. She sees my Meta ad on Instagram on Monday. She does not buy. On Thursday she searches my brand name, clicks a Google ad, and buys a $120 dress.
 Double-counting of a single sale across Meta and Google
Meta counts that sale because she saw the ad inside its view window. Google counts that same sale because she clicked inside its click window. One $120 order, counted twice, by two platforms that have no idea the other exists.
Multiply that across thousands of orders and you get exactly what I saw: the sum of platform-reported revenue exceeding actual store revenue. This is why ad platform ROAS is inflated by design, not by accident. Neither platform is lying. They just both think they won the sale.
The lesson I took from this is simple and it has saved me real money: never let an ad platform be your revenue source of truth. It cannot be. It does not have the full picture and it is not motivated to.
This is also why I eventually moved my ad bidding logic off ROAS entirely. I wrote about switching my ad bot from ROAS to profit, because optimizing toward a number the platform inflates is optimizing toward a lie.
What True Blended ROAS Actually Means
Here is the clean definition.
 Platform ROAS vs True Blended ROAS comparison
True blended ROAS = total store revenue (from Shopify, your source of truth) divided by total ad spend across all platforms combined.
Not Meta's claimed revenue. Not Google's claimed revenue. The unvarnished number your store actually recorded, divided by every dollar you spent on ads everywhere.
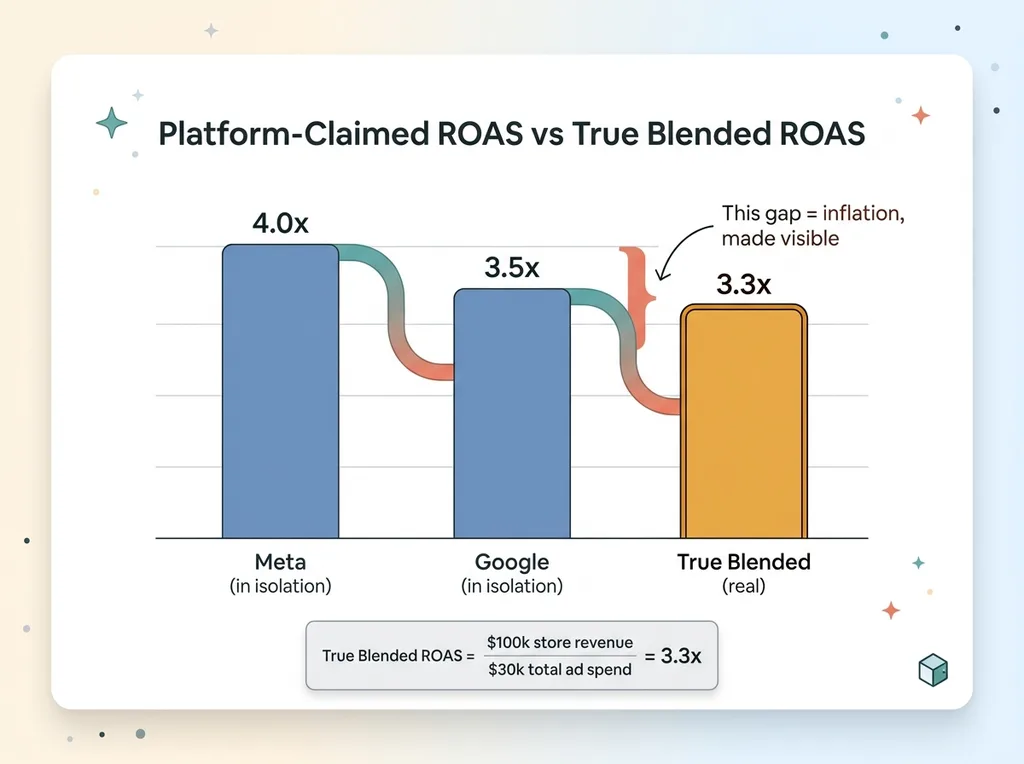
Let me work it with round numbers from my own brand. The store did $100k last month. I spent $20k on Meta and $10k on Google, so $30k total ad spend.
True blended ROAS = $100k / $30k = 3.3x.
That is the real number. One figure, no double counting, no platform taking a victory lap.
Now compare it to what the platforms told me. Meta claimed 4x in isolation. Google claimed 3.5x. Both of those are higher than my real blended 3.3x, and they always will be. Single-platform ROAS is almost always inflated relative to the blended truth, because each platform measures only its own slice and claims sales the other platform also claims.
This is the heart of getting an honest Shopify Meta Google blended profit picture. You take revenue from the one place that cannot double count it, your store, and you divide by the total you actually spent. Everything else is marketing math from the people you are paying.
The blended number is humbling the first time you see it. A channel that looked like a 5x hero in its own dashboard suddenly contributes to a 3.3x blended reality. That gap is the inflation, made visible.
But even 3.3x blended is not the whole story. Because true blended ROAS, honest as it is, still is not profit.
Revenue Minus ROAS Is Still Not Profit
This is the part that catches people who think they have already solved it. Even after you calculate honest blended ROAS, you have not measured whether you made money. ROAS only relates revenue to ad spend. It ignores almost everything else it costs to run the business.
The costs ROAS ignores
A 3.3x blended ROAS sounds healthy. But ad spend is just one line. Before a single dollar reaches my bank account as profit, I still have to subtract:
- Cost of goods sold. My products are handmade. The fabric, the labor, the materials are real money.
- Shipping. Both inbound and the cost of getting orders to customers.
- Payment processing fees. Roughly 3% of every order, every time.
- Returns and refunds. Revenue that walks right back out the door.
- Payroll. The people who make and ship and support the product.
- Software and overhead. Every subscription, every tool, the rent.
ROAS, even the honest blended kind, does not see any of that.
Why a 3x ROAS can lose money
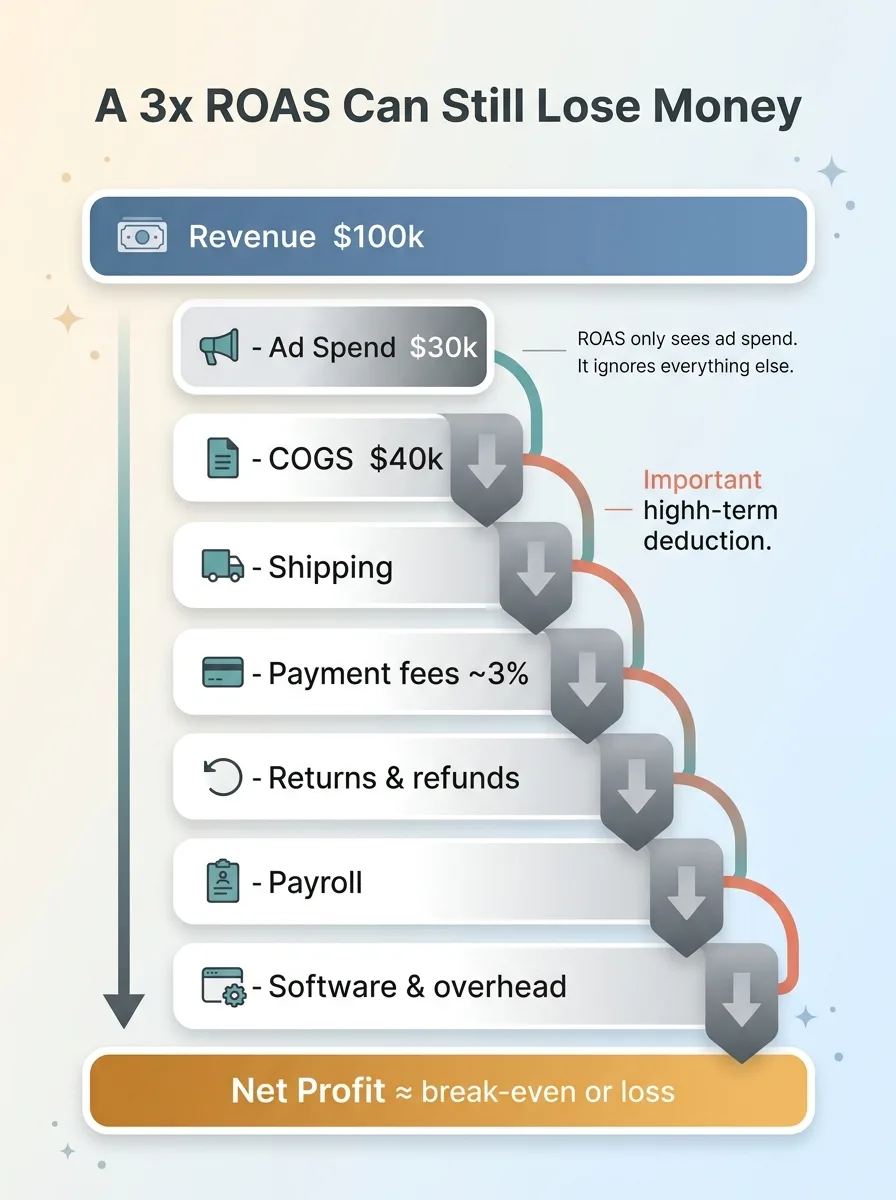
Run the example forward. I did $100k in revenue at a 3.3x blended ROAS, so $30k in ad spend. Good, right?
 From revenue to net profit, the costs ROAS ignores
Now subtract. Say COGS is $40k. Subtract the $30k in ads. That leaves $30k. Then take out shipping, payment fees, payroll, and software, and that $30k can vanish. On thin margins, a 3x blended ROAS can land you at break-even or a loss while every dashboard tells you the ads are crushing it.
That is the exact doubt I hear from owners: every platform says ROAS is great, but I cannot tell if I am actually profitable. The answer is that ROAS was never built to tell you. Only a real weekly P&L tying Shopify and QuickBooks together can. Revenue, minus COGS, minus all ad spend, minus everything else, equals net. That last number is the only one that matters.
How I Built One Weekly P&L From All Four Sources
So I built a single weekly P&L that pulls from all four tools and enforces one strict rule about where the truth comes from. This is the ecommerce finance dashboard I run my own brand on now.
Shopify is always the revenue source of truth
The non-negotiable rule: revenue comes from Shopify and only Shopify. The ad platforms are never allowed to contribute a revenue number. Ever.
This single rule kills the double-counting problem at the source. Meta and Google can claim whatever they want in their own dashboards. In my P&L, they do not get a vote on revenue. They only report what I spent.
Pulling spend and expenses via OAuth
The dashboard connects to four sources through OAuth so the data flows automatically every week:
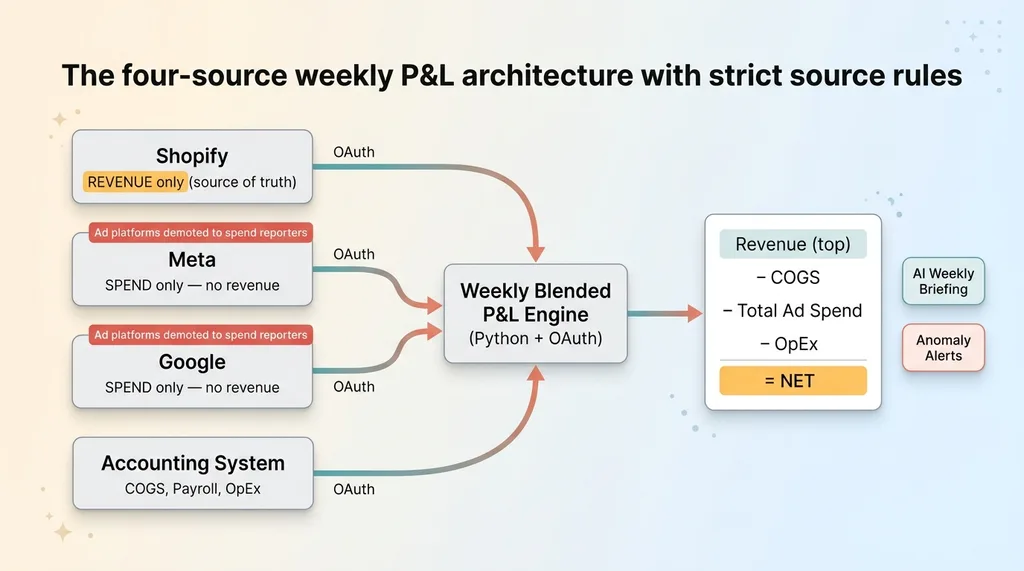 The four-source weekly P&L architecture with strict source rules
- Shopify contributes revenue. Just revenue. The source of truth.
- Meta contributes spend only. Never its claimed revenue.
- Google contributes spend only. Same rule.
- The accounting system contributes COGS, payroll, and operating expenses.
Each source does exactly one job. The ad platforms are demoted to spend reporters, which is the only thing they can report without inflating anything.
From there the math assembles itself into a weekly P&L: revenue at the top, minus COGS, minus total combined ad spend, minus OpEx, equals net. One statement. One truth. The same blended profit number I went looking for in those four tabs, now built correctly instead of impossibly.
This is the same approach I used when I built centralized analytics from seven data sources for a wider view of the business. Pull from where the truth lives, enforce strict rules about what each source is allowed to say, and let one view do the reconciling.
An AI briefing and anomaly alerts on top
The numbers alone are not enough if I have to interpret them every Monday. So I layered an AI weekly briefing on top. It reads the week's P&L and writes me a few plain-language paragraphs: what revenue did, where margin moved, which way net went, and what changed from last week.
I also wired in anomaly alerts. If ad spend spikes on one platform, I get flagged. If blended margin drops below a threshold, I get flagged. I do not have to remember to check. The system tells me when something is off before it becomes a bad month instead of after.
This took real work, around a few thousand lines of Python and the OAuth plumbing for each source, but it runs itself now. Every Monday I get the truth, summarized, with the dangerous stuff highlighted.
What the Honest Number Changed
Once I could see real blended profit instead of platform ROAS, a few things became obvious that had been hidden for months.
I found a channel that looked like a star in its own dashboard and was barely profitable once blended. In isolation it reported a strong ROAS. Once I divided by total spend and subtracted real costs, it was contributing almost nothing to net. I had been about to give it more budget. The honest number stopped me.
I also caught weeks where revenue was up but net was down. Ad spend had crept up faster than revenue, so the top line looked like a win while the bottom line quietly bled. On a platform ROAS view that week looked great. On the blended P&L it was a warning.
Most importantly, I started making budget decisions on real margin instead of inflated platform numbers. When I add spend now, I know what it does to net, not just what Meta says it did to its own ROAS.
I want to be honest about the limits, though. This is a reporting and decision tool, not a magic profit machine. It does not make me more money on its own. It shows me the truth, clearly and weekly. I still have to act on what it shows, cut the channel that is not working, pull spend back when margin slips, fix the product that returns too often. The dashboard does not do any of that. It just makes sure I am deciding on real numbers instead of flattering ones.
If You Are Flying on Platform ROAS, You Are Flying Blind
Most DTC owners I talk to are making budget calls on numbers their ad platforms grade themselves on. They are not being careless. They just have not seen the structural problem, that the sum of platform-claimed revenue is always inflated and that ROAS was never profit to begin with.
The good news is the blended truth is buildable. It is not exotic. It takes pulling the right sources, demoting the ad platforms to spend-only, treating your store as the single source of revenue, and rolling it all into one weekly P&L. The rules matter more than the technology.
This is exactly the kind of system I build into the brands and clients I work with, the same finance view that runs my own apparel brand alongside the rest of the systems that run my apparel brand. I built it because I needed it. Now I build it for people who are tired of guessing whether a good month was actually a profitable one.
If you cannot see your true blended profit in one place right now, you are not running your business. You are running your ad platforms' version of it.
Thinking about AI for your business?
If this resonated, let's have a conversation. I do free 30-minute discovery calls where we look at your operations and identify where AI could actually move the needle.
Get AI insights for business leaders
Practical AI strategy from someone who built the systems — not just studied them. No spam, no fluff.
Hodgen.AI
Ready to automate your growth?
Book a free 30-minute strategy call with Hodgen.AI.
Book a Strategy Call