Social Media Data Analysis: 90 Days Rewrote My Playbook
I ran a social media data analysis on 90 days of my own posts. The findings killed every scheduling assumption I had. Here's what the data showed.
By Mike Hodgen
My Scheduler Was Posting on Gut Feel and Calling It Strategy
I built an AI scheduler for my DTC fashion brand in San Diego that drafted a full week of social posts, picked the slots, and queued everything up while I slept. On paper it was a clean little automation. In practice, it was confidently wrong.
Here is what social media data analysis eventually told me about my own setup, and what it should have told me months earlier.
The scheduler was pulling from a content pool that looked nothing like my actual channel. It was 100% still product images. No memes, no Reels, no carousels. Just catalog shots, lined up in a row, dropping every night at 9pm because I had read somewhere that 9pm was the golden hour.
It got worse. The pool had zero real engagement metadata attached to any of the posts. A token-limit bug was silently dropping that data before it ever reached the model. So the system was making scheduling decisions with no idea which posts had actually performed.
I had assumptions baked straight into code. Best time to post: a guess. Best format: a guess. Best cadence: a guess. None of it was backed by a single number from my own account.
That is the trap. I was automating a hunch and calling it a strategy because it ran on a schedule and produced output.
Most founders do exactly this. They just do not admit it, because the automation feels sophisticated. The dashboard looks busy. The posts go out on time. It all reads like competence.
But a fast machine pointed at the wrong target just gets you to the wrong place quicker. I had to stop trusting the automation and start interrogating it.
Why I Pulled 90 Days of My Own Posts Instead of Reading Best-Practice Blogs
The data you already own beats the data someone else generalized
Every "best time to post" article online is averaged across millions of accounts that have nothing to do with yours. Different audiences, time zones, industries, follower counts. When someone tells you 9pm is best, they are handing you the mean of a dataset you are not in.
The only dataset that matters is your own channel. Your followers, your formats, your posting history. That is the data I should have been mining from day one, and it was sitting in my account the whole time.
So before I touched another line of scheduler code, I went and looked. This is the principle I keep coming back to: listen before you automate. You cannot build a smart system on top of assumptions you never tested.
What a content performance audit actually measures
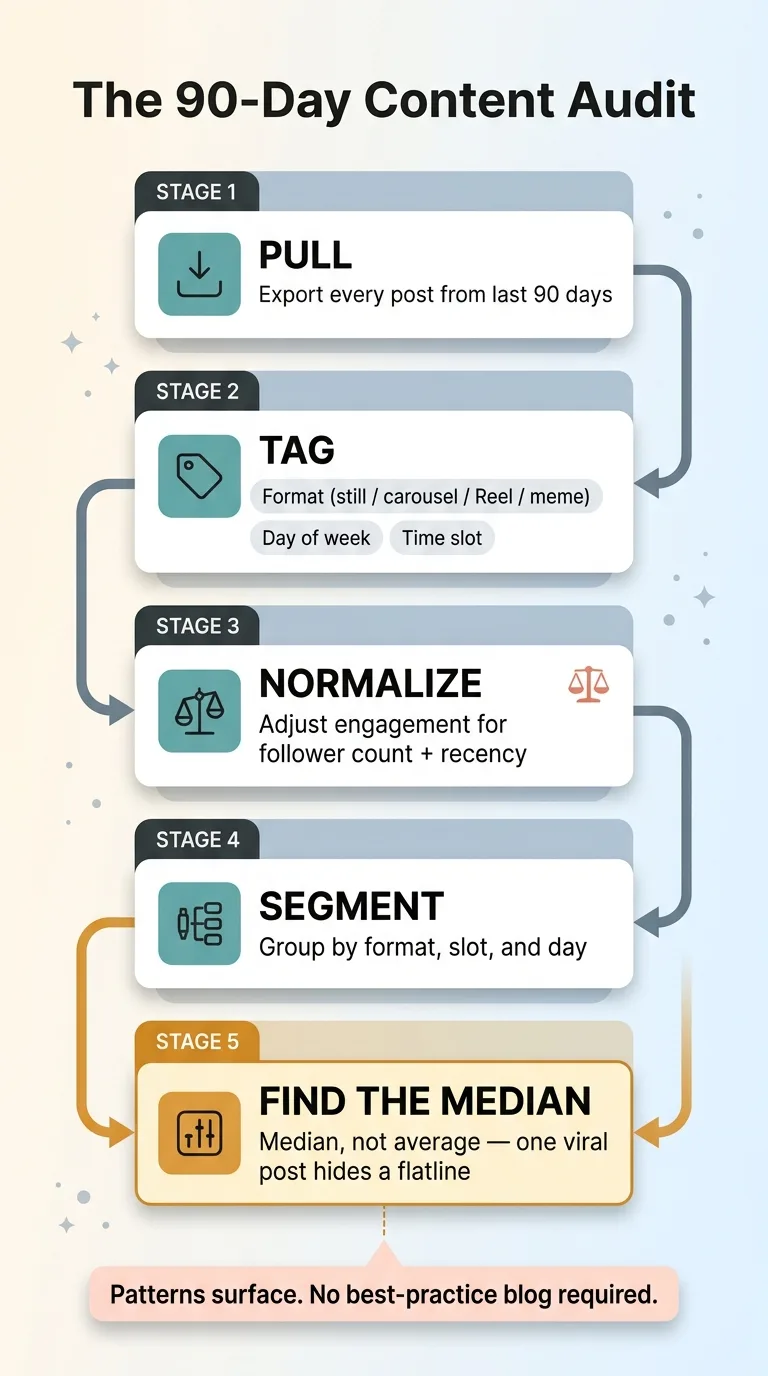
I pulled every post over the last 90 days. Then I tagged each one by format (still, carousel, Reel, meme), by day of week, and by time slot. Then I attached the real engagement numbers.
 The content performance audit method
A content performance audit is not "which post got the most likes." Raw counts lie. A post from 90 days ago had fewer followers to reach than one from last week, so you have to normalize engagement against follower count and recency.
Then I found the median engagement per format, per slot, and per day. Median, not average. One viral post can drag the mean up so high that it hides the fact that everything else flatlined. The median tells you what a typical post in that bucket actually does.
That is the whole audit. Normalize, segment, find the median, and let the patterns surface. No theory, no best-practice blog. Just my channel, telling me what it had been telling me all along.
Finding 1: Memes Carried the Channel at 8x Median Engagement
The first finding was the one I did not want to see.
 Format engagement ranking (memes 8x, Reels 5x, stills worst)
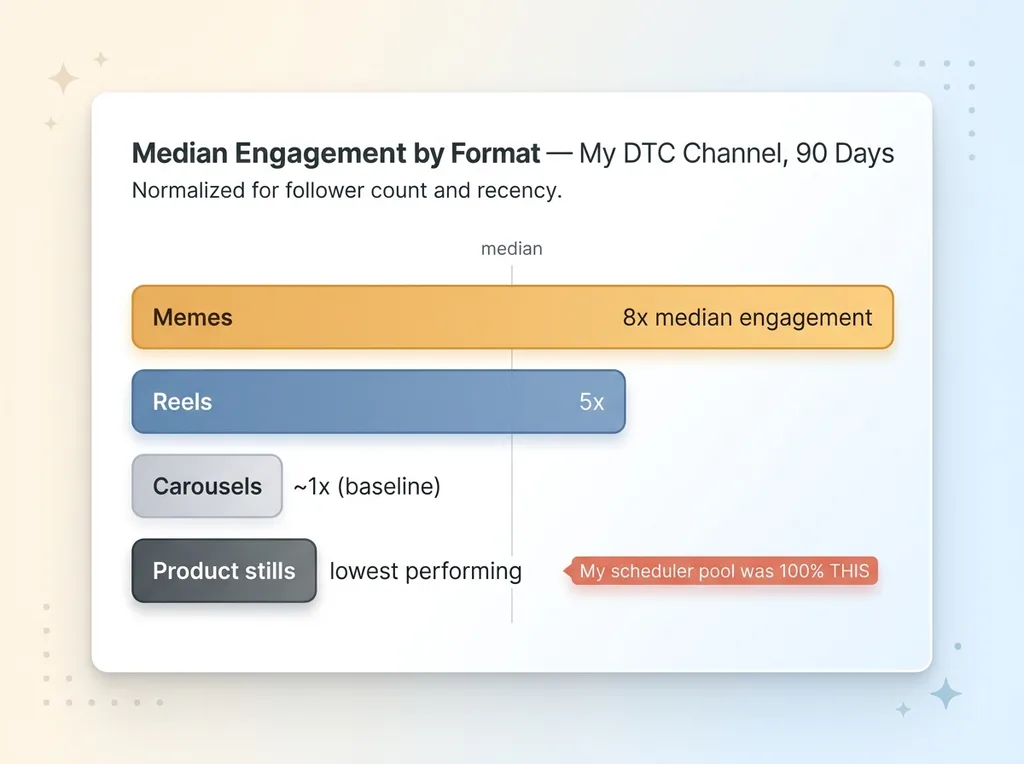
Memes earned roughly 8x the median engagement of everything else on the channel. Eight times. And my scheduler pool contained exactly zero of them. It was 100% product stills.
My audience did not want a catalog. They wanted personality, humor, a reason to stop scrolling. I had been feeding them the one thing they cared about least.
This is the gut-feel trap in its purest form. I assumed a fashion brand should post the product, because of course it should. The clothes are the whole business. But the data said the product stills were the single worst-performing format on the entire channel.
That was uncomfortable to learn. I had built the pool around an assumption that felt so obvious it never occurred to me to test it. The numbers did not care how obvious it felt.
Now, there is a nuance here that matters, and I have written about it in detail: the split between organic engagement and paid performance. Memes win organic engagement, but they do not always convert when you put paid spend behind them. A funny meme builds reach and affinity. A clean product shot does the selling once the ad budget is involved.
So this was never about abandoning product posts. It was about format mix. The organic channel needed memes to grow and stay alive. The paid side still needed product. The mistake was running one format for both jobs and wondering why the organic engagement was dead.
Finding 2: Reels Beat Carousels 5-to-1, and 5pm Was the Real Golden Hour
The best time to post analysis nobody guesses right
Two more findings landed back to back, and both contradicted what I had hardcoded.
 Best time to post, generic 9pm assumption vs real 5-6pm data
First, format. Reels delivered roughly 5x the engagement of carousels. My pool was neither. It was static stills, which sat below both. So I had been running the worst-performing format while the two strongest sat untouched.
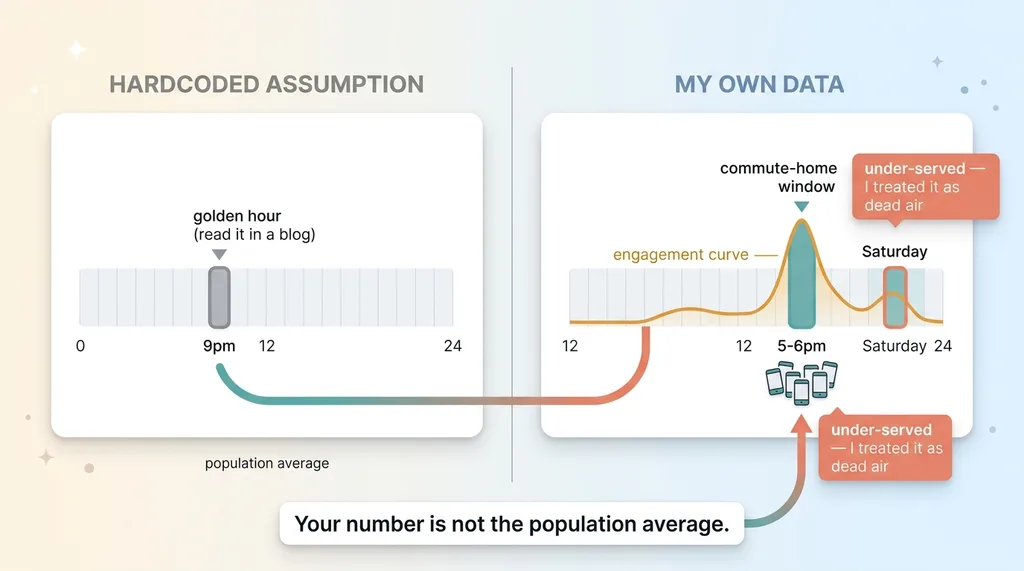
Second, timing. I had hardcoded 9pm based on conventional wisdom. The data said the prime slot was 5 to 6pm. The commute-home window. People pulling out their phones on the train, in the passenger seat, on the couch right after work. Not late-night scrolling, which was when I had been dropping everything.
A best time to post analysis run on your own data contradicts the generic advice almost every time. The generic number is a population average. Your number is your audience's actual behavior. They are rarely the same, and the gap is where you are losing reach.
Format ranking changes your whole content budget
There was a third pattern hiding in the day-of-week breakdown: Saturday was badly under-served. I had been treating it like a dead zone when the engagement data said otherwise.
Findings like these do not just tweak a schedule. They reroute where you spend production effort. If Reels beat carousels 5-to-1, why is anyone on my team building carousels? If memes pull 8x, writing a sharp meme is worth more than another product shoot.
The audit told me to stop building the thing I was good at building and start building the thing the audience actually rewarded. That is a budget decision dressed up as a content decision.
Turning Audit Findings Into Code: Four Fixes I Shipped
An audit that does not change behavior is a vanity exercise. A pretty chart you nod at and then ignore. So every finding became a concrete change in the AI scheduler I built to plan a week of posts.
 Four scheduler fixes shipped from audit findings
A data-driven slot profile
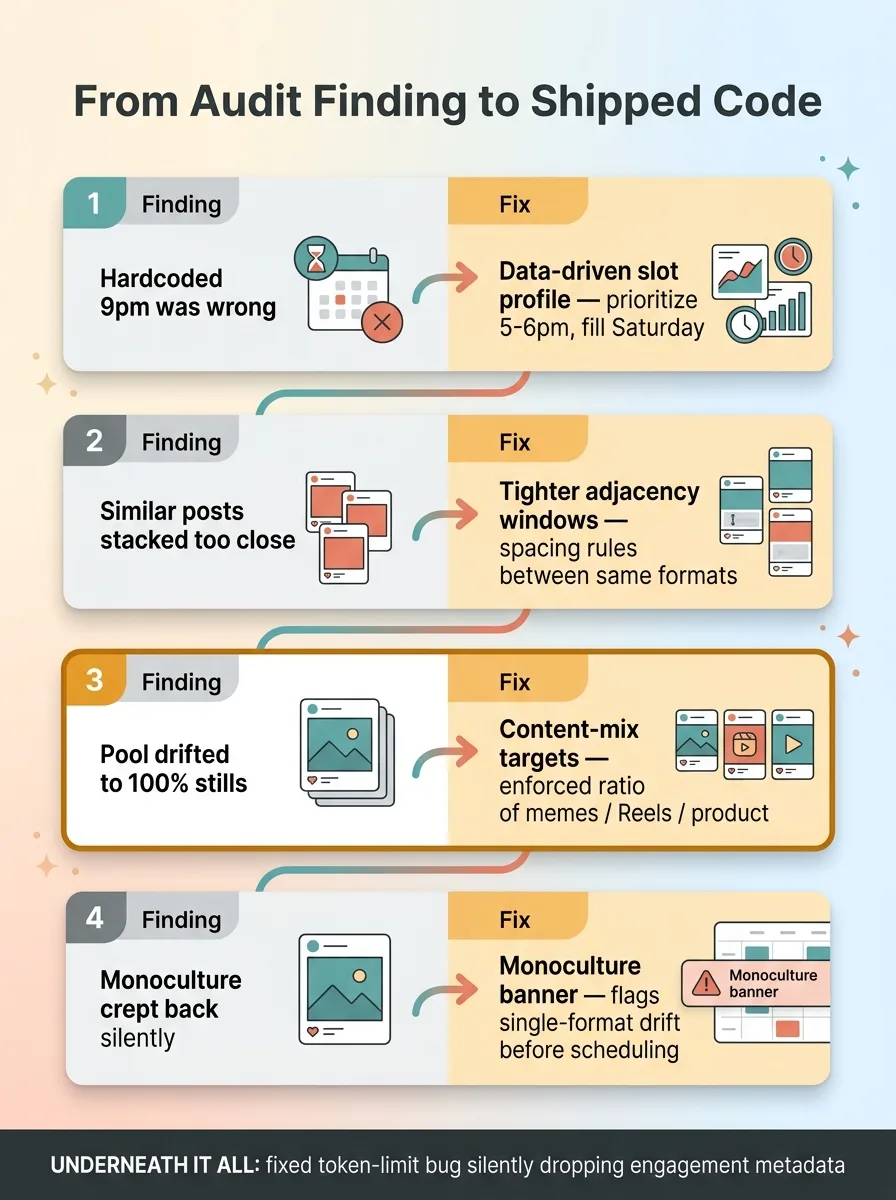
First fix: I replaced the hardcoded 9pm assumption with a data-driven slot profile. The scheduler now prioritizes the 5 to 6pm window and actively fills the under-served Saturday slot instead of treating the weekend as dead air.
The timing is no longer my opinion. It is the median engagement curve from my own 90 days, encoded directly into how the system picks slots.
Second fix: tighter adjacency windows. The old scheduler would happily stack two similar posts close together, which buried one and exhausted the audience. Now there are spacing rules so two posts of the same format do not crowd each other on the timeline.
Content-mix targets and a monoculture banner
Third fix, and the most important one: content-mix targets. Instead of letting the pool drift to 100% stills, the scheduler now enforces a ratio. A target share of memes, a target share of Reels, a controlled amount of product. The mix is the strategy now, not an accident of whatever happened to be in the pool.
Fourth fix: a monoculture banner. When the pool drifts back toward a single format, the system flags it before anything gets scheduled. It is a guardrail against exactly the failure I started with, a pool quietly collapsing into one format while I assumed it was balanced.
And underneath all of it, I fixed the token-limit bug that had been silently dropping engagement metadata. Now the real performance data flows through every time. The next audit, and the one after that, runs on real numbers instead of a corrupted feed.
That last fix matters more than it sounds. An audit is only as good as the data going in. If your pipeline is quietly eating the most important field, every conclusion downstream is built on sand.
What This Costs You When You Skip It
Here is the part nobody puts a number on.
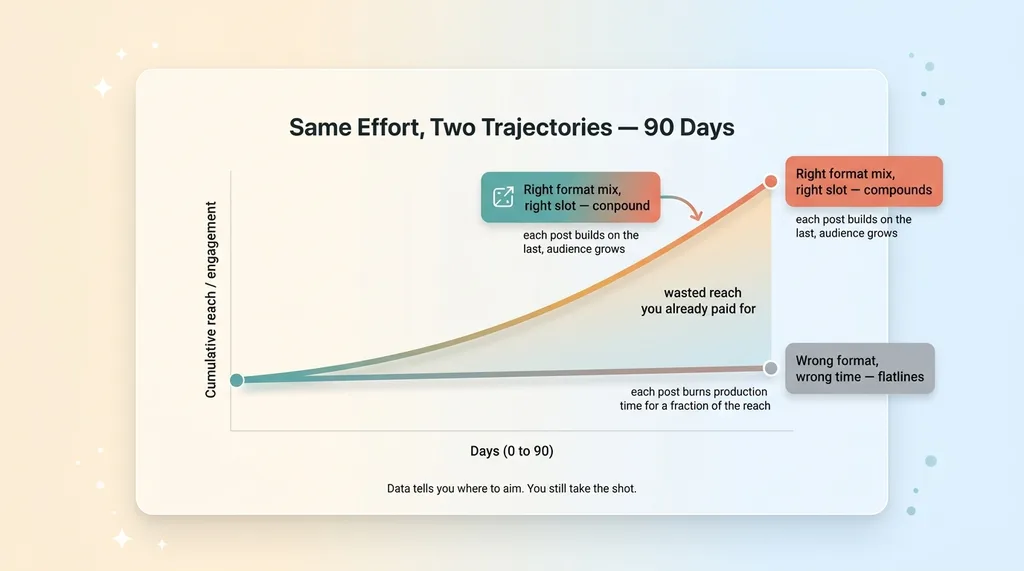 Compounding channel vs flatlining channel over 90 days
Every post in the wrong format at the wrong hour is wasted reach. You paid for it in production time, in the photographer's hours, in the design work, in your own attention. And it landed in front of fewer people than it should have, in a format the audience cared about least.
Run that over 90 days. If you are posting 100% of the wrong format at the wrong time, the math is brutal. Most of your effort produced a fraction of the engagement it could have. You were not slightly under-optimized. You were systematically pointed away from what worked.
This is not a marginal tweak. It is the difference between a channel that compounds, where each post builds on the last and the audience grows, and one that flatlines while you keep feeding it. Same effort, completely different trajectory.
One honest caveat. A data-driven content strategy does not replace taste. It focuses it.
The audit told me memes pulled 8x. It did not write a single funny meme. It told me Reels beat carousels 5-to-1. It did not shoot a good Reel. I still had to make the content land. The data just made sure I was pouring that creative effort into the formats and slots that actually paid it back.
Data tells you where to aim. You still have to take the shot.
Your Own Data Already Knows What's Working
Your account has 90 days of answers sitting in it right now. The best time to post, the format your audience rewards, the day you have been ignoring. All of it, recorded, waiting.
Most founders never pull it. Not because they do not care, but because the export is annoying and the analysis is tedious. Tagging every post by format and slot, normalizing for follower count, finding medians instead of averages. It is a slog by hand.
That tedium is exactly what a system handles in minutes. The whole reason I build these tools is to turn an afternoon of spreadsheet drudgery into a report I read with coffee.
This is the through-line in everything I do. I do not guess. I audit the data first, then I turn the findings into code that enforces them. The scheduler stopped posting on gut feel because the audit gave it something better to run on.
If you are scheduling on instinct right now, the cheapest first move is not a new tool or a new agency. It is to look at what your own data is telling you. The answers are already there. You just have to read them.
Thinking about AI for your business?
If this resonated, let's have a conversation. I do free 30-minute discovery calls where we look at your operations and find where AI could actually move the needle, no slides, no pitch.
Get AI insights for business leaders
Practical AI strategy from someone who built the systems — not just studied them. No spam, no fluff.
Hodgen.AI
Ready to automate your growth?
Book a free 30-minute strategy call with Hodgen.AI.
Book a Strategy Call