Prediction Markets as Trading Signals: How I Integrated Polymarket Into My AI System
How I turned prediction markets into trading signals by integrating Polymarket into an AI trading system. Real architecture, real code decisions, real results.
By Mike Hodgen
I was watching a Fed rate decision last year, flipping between CNBC and Bloomberg. The pundits were split almost evenly — half said hold, half said cut. Reasonable arguments on both sides. Classic financial media theater.
Then I checked Polymarket. The contract for a rate hold was trading at $0.87. The crowd with real money on the line wasn't conflicted at all. They had 87% conviction. The Fed held. Polymarket was right. The talking heads were noise.
That was the moment I started treating prediction markets as trading signals — not as curiosities or gambling platforms, but as genuine data inputs worth engineering around.
This isn't a new idea in theory. Hayek wrote about the power of distributed knowledge aggregation in 1945. Surowiecki's The Wisdom of Crowds (2004) formalized why large groups of diverse, independent thinkers consistently outperform individual experts. But for a long time, prediction markets lacked the liquidity and coverage to be practically useful. That's changed. Polymarket alone has crossed $1B+ in cumulative volume, covering macro events — elections, rate decisions, geopolitical flashpoints, regulatory outcomes — with enough depth to generate real signals.
The thesis is simple: prediction markets are leading indicators because they aggregate thousands of real-money bets from participants who have skin in the game. That makes them fundamentally different from surveys, polls, analyst forecasts, or cable news panels. When someone puts $50,000 on a rate hold at $0.87, they've done their homework. Or they haven't, and the market corrects them. Either way, the price reflects aggregated conviction in a way that no single analyst can.
I'd already built the AI trading bot from scratch with technical analysis and fundamental data inputs. But I was missing something — a signal that captured what the crowd with money on the line actually believed was going to happen. Prediction market data filled that gap.
How Prediction Markets Actually Work as Trading Signals
The Signal Isn't the Odds — It's the Movement
If you're not familiar with the mechanics: prediction markets let people buy "shares" in binary outcomes (Yes/No) that pay $1 if the outcome occurs. A contract trading at $0.73 means the crowd currently prices that outcome at a 73% probability. Simple enough.
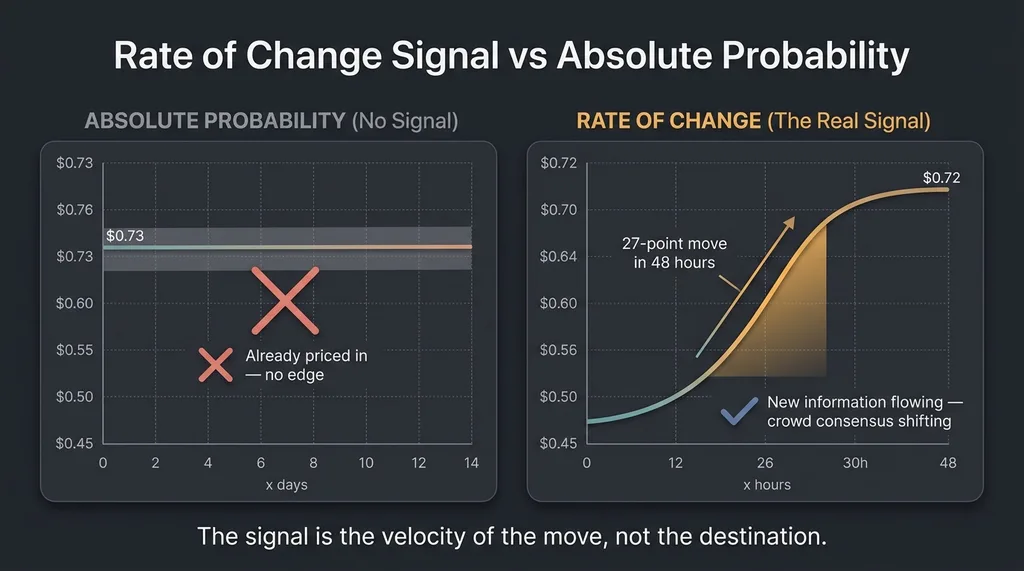 Rate of Change Signal vs Absolute Probability
But here's the insight most people miss when they first look at this data: the absolute probability is not the useful signal. The rate of change in probability is.
A Fed rate cut contract sitting at $0.73 for two weeks tells you nothing new. But that same contract moving from $0.45 to $0.72 in 48 hours tells you something massive — crowd consensus is shifting rapidly in one direction, often because informed participants are seeing signals the broader market hasn't priced in yet.
That 27-point move in 48 hours is the signal. It means new information — or a new interpretation of existing information — is flowing into the prediction market. And because prediction markets settle on binary outcomes tied to real-world events, that flow often precedes the corresponding move in equities, bonds, or currencies.
Which Markets Actually Matter for Trading
Not all prediction markets map to tradeable instruments. The ones that do:
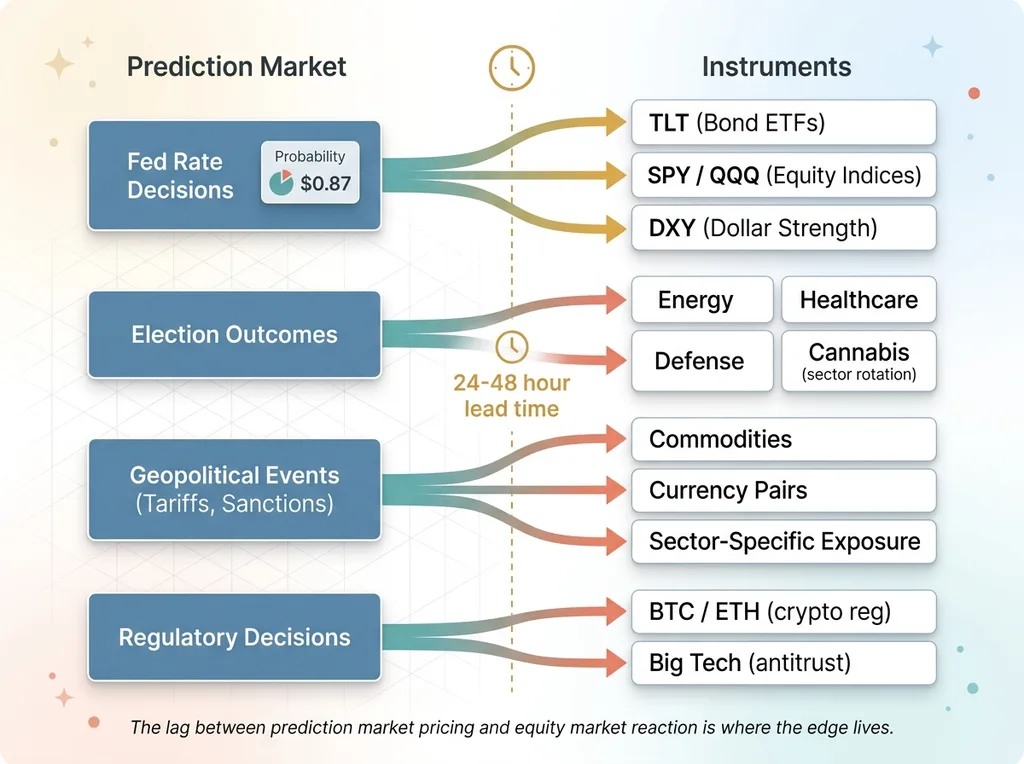 Prediction Market to Trading Instrument Mapping
- Fed rate decisions → direct impact on bond ETFs (TLT), equity indices (SPY, QQQ), and dollar strength (DXY)
- Election outcomes → sector rotation plays (energy, healthcare, defense, cannabis — depending on who's winning)
- Geopolitical events (tariffs, sanctions) → commodity moves, currency pairs, and specific sector exposure
- Regulatory decisions → individual stock or sector-level impact (crypto regulation → BTC, ETH; antitrust → big tech)
A concrete example: earlier this year, tariff probability on Polymarket shifted sharply over a three-day window. Specific manufacturing and import-heavy sectors moved 24-48 hours after the prediction market priced it in. The crowd — people with real money betting on whether tariffs would actually happen — was ahead of the equity market by a meaningful window.
That lag is where the signal lives.
The Polymarket API: What You Actually Get (and What You Don't)
Data Structure and Polling Architecture
Polymarket runs on the Polygon blockchain and operates a CLOB (Central Limit Order Book). Their API gives you:
- Market metadata (question, description, resolution criteria)
- Current prices for Yes/No outcomes
- Order book depth
- Historical price data for active markets
- Volume figures
That's a solid foundation. My architecture is a Python polling service that hits Polymarket's API every 60 seconds for a curated watchlist of markets. Each poll stores a price snapshot in a time-series format. From those snapshots, I calculate rate-of-change metrics across four windows: 1 hour, 6 hours, 24 hours, and 48 hours.
The 24h and 48h rate-of-change metrics are the most useful for my trading timeframes. The 1h metric catches sudden spikes but generates more noise than signal.
I also maintain a manual mapping table that connects specific Polymarket markets to the trading instruments they're most likely to impact. For example: "Fed rate cut March 2026" maps to SPY, TLT, and DXY. "EU AI regulation passage" maps to specific tech ETFs. This mapping is the actual intellectual work — the API integration itself took maybe a day.
The Gaps You Need to Engineer Around
The API isn't perfect. Some things I had to solve:
- No clean real-time websocket streams for all markets. You poll. My 60-second interval is a good balance between freshness and rate limit management.
- Resolved markets lose their historical data accessibility. I archive everything locally before resolution. If you don't, you lose the ability to backtest.
- No built-in categorization by financial relevance. Polymarket lumps "Will it snow in NYC on Christmas?" next to "Will the Fed cut rates?" You need your own filtering layer.
- Rate limiting. Not aggressive, but you'll hit it if you try to poll hundreds of markets every few seconds.
- Low-liquidity markets give false signals. A market with $12K in volume can swing 20 points on a single order. I hard-filter anything under $100K total volume. Below that threshold, the "crowd" is three guys and a bot.
Combining Prediction Market Odds With Technical Analysis
The Confluence Scoring System
Prediction market data alone isn't a trade signal. It's a conviction modifier.
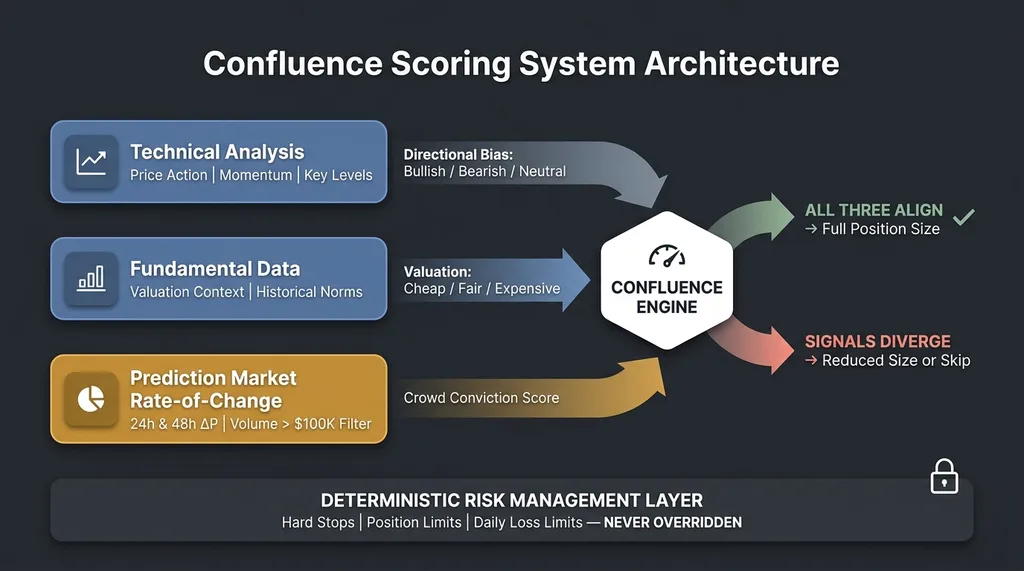 Confluence Scoring System Architecture
I built a confluence scoring system where prediction market movement is one of several weighted inputs feeding into the decision engine. Here's the framework:
- Technical analysis provides a directional bias — bullish, bearish, or neutral — based on price action, momentum indicators, and key levels.
- Fundamental data provides valuation context — is the instrument cheap, fair, or expensive relative to historical norms?
- Prediction market rate-of-change provides a "crowd conviction" score — is smart money shifting consensus toward an outcome that would benefit or hurt this position?
When all three align, position size increases. When they diverge, position size decreases or the trade gets skipped entirely.
Specific example: Technical analysis showed a bullish setup on a sector ETF — higher lows, momentum divergence, approaching a breakout level. Meanwhile, the Polymarket contract for a related policy outcome moved from $0.60 to $0.78 over three days. The crowd was growing more convinced of an outcome that would directly benefit that sector. Confluence score: high. The trade was taken at full size. It paid.
When Crowds and Charts Disagree
This is where it gets nuanced. When prediction markets and technicals disagree, I've learned to trust the crowd money over the chart pattern roughly 60% of the time — but only for event-driven moves. If a macro event is the catalyst, the prediction market is closer to reality. If there's no macro catalyst and the setup is purely technical, the prediction market data is irrelevant noise, and I ignore it.
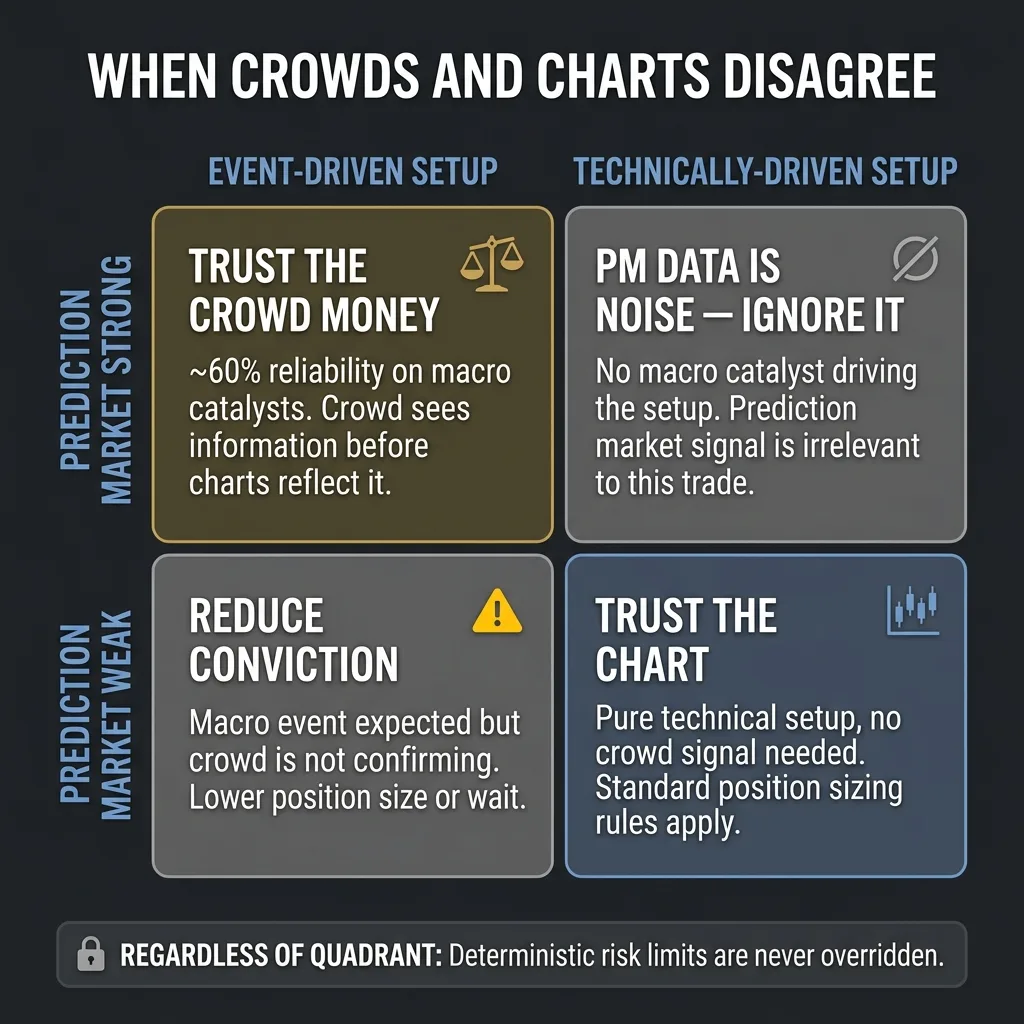 When to Trust Crowds vs Charts Decision Framework
My multi-model AI architecture handles this by assigning different models to different signal domains. One model focuses on technical patterns. Another interprets the prediction market context. The system synthesizes across them, weighting each based on whether the current setup is event-driven or technically driven.
And here's the critical piece: regardless of how strong the prediction market signal is, the deterministic risk management layer never gets overridden. Hard stops, position limits, daily loss limits — those are non-negotiable. No amount of crowd conviction bypasses the math that keeps you solvent.
What Worked, What Didn't, and the Numbers So Far
The Wins
Event-driven trades where prediction market movement gave 24-48 hours of lead time before the broader market reacted. That's consistently been the highest-value signal this system produces for macro trades.
Trades taken with high prediction market confluence — where rate-of-change was strong and aligned with technical and fundamental signals — showed a meaningfully higher win rate than trades without that confluence. I'm seeing roughly a 12-15% improvement in win rate on event-driven setups, and a noticeable improvement in risk-adjusted returns because the conviction-based sizing puts more capital behind the highest-probability trades.
The rate-of-change metric specifically has been the single best addition to the system for macro event positioning.
The Failures
Plenty.
Using absolute probability levels as signals was a dead end. A market sitting at $0.80 for three weeks has already been priced in by everything else. No edge there.
Low-volume prediction markets were unreliable. I lost real money trusting a signal from a market with under $50K in volume before I implemented the $100K floor. Expensive lesson, cheap tuition.
Earnings-related prediction markets don't work — there aren't enough of them, and the ones that exist are too thin to generate meaningful signals. This is a gap in coverage that may close eventually, but right now it's not there.
Prediction markets can be wrong. They're not oracles. They priced certain high-profile events incorrectly, and anyone who treated the 85% probability as certainty got burned. The system treats prediction market data as probabilistic input, not gospel. A 0.85 probability still means a 15% chance of being wrong, and the risk management layer is sized for that.
I should also be transparent: attributing returns to a single signal source in a multi-factor system is inherently messy. I'm confident the prediction market signal is adding value based on the comparative analysis, but the sample size on event-driven trades is in the dozens, not thousands. I'm sharing this because it's real, not because it's statistically bulletproof yet.
Building Your Own Prediction Market Data Pipeline
If you want to replicate something like this, here's the practical path:
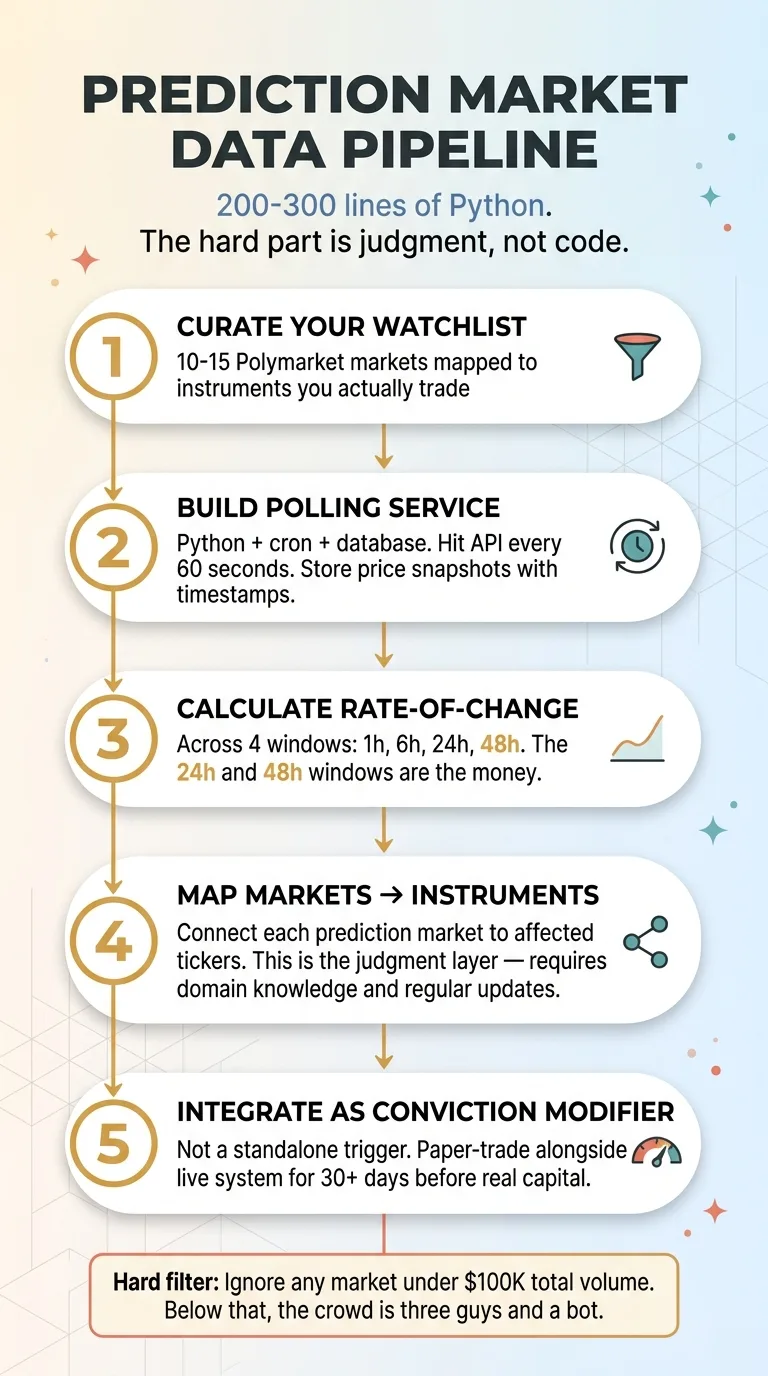 5-Step Prediction Market Data Pipeline
Step 1: Identify 10-15 Polymarket markets that map directly to instruments you actually trade. Don't monitor everything. Monitor what matters to your portfolio.
Step 2: Build a polling service. Python, a cron job, a simple database. Hit the API, store price snapshots with timestamps. This is not complex engineering.
Step 3: Calculate rate-of-change across multiple timeframes — 1h, 6h, 24h, 48h. The rate-of-change is your signal, not the raw price.
Step 4: Build a mapping table connecting each prediction market to the trading instruments it affects. This is the judgment layer. It requires domain knowledge, and it needs regular updating as new markets appear and old ones resolve.
Step 5: Integrate the signal as a conviction modifier in your existing system. Not as a standalone trigger. Start by paper-trading with the signal alongside your live system for at least 30 days before giving it any weight in real capital allocation.
The whole pipeline is maybe 200-300 lines of Python. The hard part isn't the code. It's the judgment: which markets matter, how much weight they deserve, and when to ignore them entirely. That's the part no tutorial can give you.
Where This Goes Next: Real-Time Sentiment Meets Crowd Conviction
The next evolution I'm building combines prediction market data with real-time social media sentiment analysis — specifically, using X/Twitter sentiment as a leading indicator for prediction market movement, which itself leads broader market movement. That's a two-step lead time that, if it holds up, significantly extends the reaction window.
The broader architecture is an AI finance team where each agent specializes. One watches prediction markets. One monitors sentiment. One runs technical analysis. One manages risk. The prediction market agent is one specialist on that team, not the whole team.
The core thesis hasn't changed: the best AI systems — trading or otherwise — don't rely on a single signal source. They combine diverse, uncorrelated inputs into probabilistic decisions. Prediction markets are one of the most underused inputs available right now, and the Polymarket API makes them accessible to anyone willing to do the engineering.
This is exactly the kind of system I build. Not just for my own trading, but for businesses that need AI architectures combining multiple data sources into actionable decisions. The pattern is the same whether you're aggregating market signals, customer data, or operational metrics — you need diverse inputs, smart weighting, and a deterministic layer that keeps you from blowing up when the model is wrong.
If This Is How You Think About Problems, Let's Talk
If this resonated — the approach of combining non-obvious data sources, building lightweight pipelines that punch above their weight, and letting AI synthesize what humans can't track manually — that's the same methodology I apply to business operations, not just trading.
I do free 30-minute discovery calls where we look at your specific operations and identify where AI could actually make a measurable difference. No slides. No pitches. Just an honest conversation about what's possible.
Get AI insights for business leaders
Practical AI strategy from someone who built the systems — not just studied them. No spam, no fluff.
Hodgen.AI
Ready to automate your growth?
Book a free 30-minute strategy call with Hodgen.AI.
Book a Strategy Call