Building a Quant Data Pipeline in Python With FRED + Finnhub
How I built a quant data pipeline in Python combining FRED macro data, Finnhub market data, and Fear & Greed signals. Full architecture and sentinel pattern.
By Mike Hodgen
Most quant tutorials show you how to call an API. Pull some stock quotes from Finnhub. Grab GDP data from FRED. Maybe plot it in a Jupyter notebook and call it a day.
That's not a pipeline. That's a demo.
I built a quant data pipeline in Python because the AI trading bot I built needed to make decisions using macro economic data, real-time market quotes, and sentiment signals — simultaneously, reliably, 24/7. Three data sources. Different rate limits. Different update frequencies. Different failure modes. Different data formats. And the bot needed all of it synthesized into a single, trustworthy picture of the market before every trade.
The Problem: Three Data Sources, Zero Unified Pipeline
Before I built the pipeline, I had ad hoc API calls scattered across the codebase. FRED calls here, Finnhub calls there, a scraper for CNN's Fear & Greed Index bolted on as an afterthought. It kind of worked — until it didn't.
I was hitting rate limits during high-volatility periods when I needed data most. I was making trading decisions on FRED data that was hours stale without the system knowing it. Finnhub would throw a 429 error and the bot would just... not have a current price. No fallback. No flag. Just silence where data should have been.
The scale of the problem is deceptive. FRED has 800,000+ time series covering every corner of the U.S. economy. Finnhub covers real-time quotes, company financials, and market metadata. The Fear & Greed Index is a single number between 0 and 100 — but it's a composite of seven market indicators that moves markets.
The challenge was never "how do I call an API." It was orchestration. How do I keep three fundamentally different data sources feeding clean, timestamped, validated data into a single system without spinning up Kubernetes, Kafka, or anything that costs more than a cup of coffee to run?
That's what I built. And the patterns turned out to be useful far beyond trading.
Architecture: What the Quant Data Pipeline Actually Looks Like
The architecture has three layers, and each one exists for a specific reason.
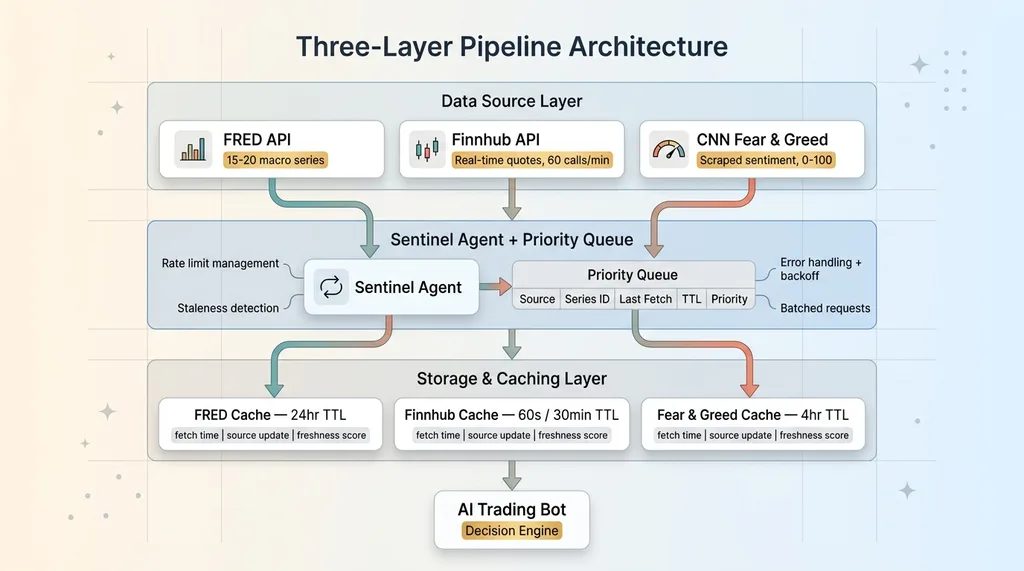 Three-Layer Pipeline Architecture
Data Source Layer
Three sources, three dedicated fetcher classes:
- FRED — Macro indicators: Federal Funds Rate, yield curves, CPI, unemployment, GDP, M2 money supply. I pull about 15-20 key series out of the 800,000+ available. Each one chosen because it directly informs whether the macro environment is favorable for the positions my bot takes.
- Finnhub — Real-time quotes, company profiles, basic financials, market status (is the market actually open right now?). Free tier gives 60 API calls per minute, which is plenty when you're managing a focused portfolio instead of scanning the entire Russell 3000.
- CNN Fear & Greed Index — Sentiment scoring. No official API exists, so this is scraped. A single number, but it's derived from market momentum, stock price strength, breadth, put/call ratios, junk bond demand, VIX, and safe haven demand.
Each fetcher handles its own authentication, rate limiting, and error handling. The FRED fetcher doesn't need to know Finnhub exists. Clean separation.
Queue and Sentinel Pattern
This is the core of the system. A sentinel agent watches a request queue and makes smart decisions about what to fetch and when.
The sentinel maintains a priority queue where each request has: data source, series ID, last fetch timestamp, TTL (time-to-live), and a priority score. It runs in a persistent loop — not a cron job, not a Lambda function. A Python process that manages its own state and makes real-time decisions about data freshness.
When the sentinel wakes up, it scans the queue for stale data, batches requests to stay within rate limits (critical for Finnhub's 60/minute cap), executes the fetches, handles errors, and goes back to sleep. It knows that FRED data doesn't need refreshing more than once a day, that Finnhub quotes matter most during market hours, and that Fear & Greed can wait a few hours between checks.
Storage and Caching
Data lands in a structured cache with TTL values calibrated per data type:
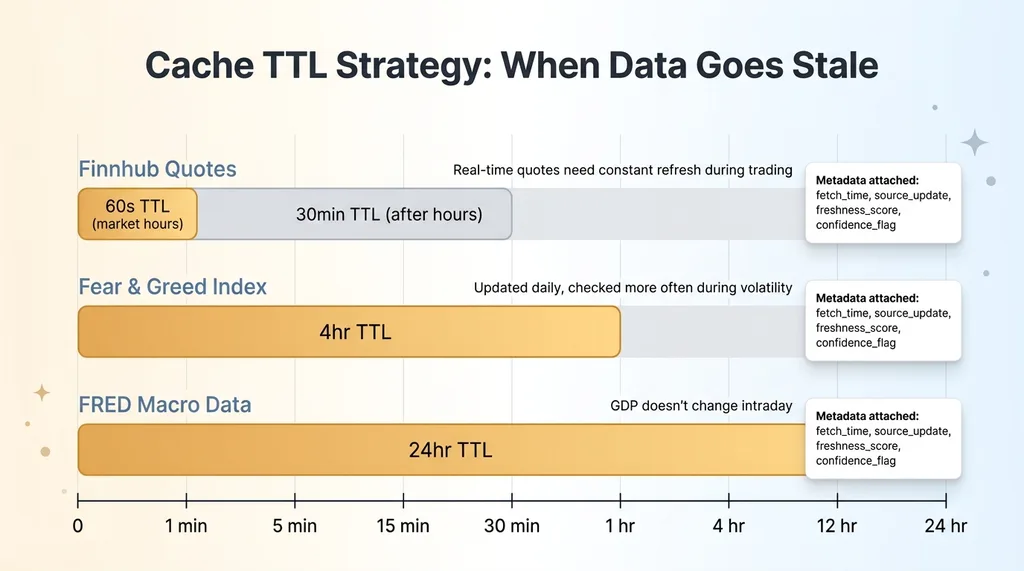 Data Freshness TTL Strategy by Source
- FRED macro data: 24-hour TTL. GDP doesn't change intraday.
- Finnhub quotes: 60-second TTL during market hours, 30-minute TTL after close.
- Fear & Greed: 4-hour TTL. It's updated once daily but I check more often during high-volatility periods.
Every cached value carries metadata: when it was fetched, when the source says it was last updated, and a freshness score. The trading system always knows exactly how old its data is.
FRED API: Pulling Macro Data That Actually Matters for Trading
FRED is an incredible resource, but 99.9% of it is irrelevant to active trading decisions. The value is in picking the right series and understanding what they tell you.
The Indicators I Actually Use
Here's what I pull and why:
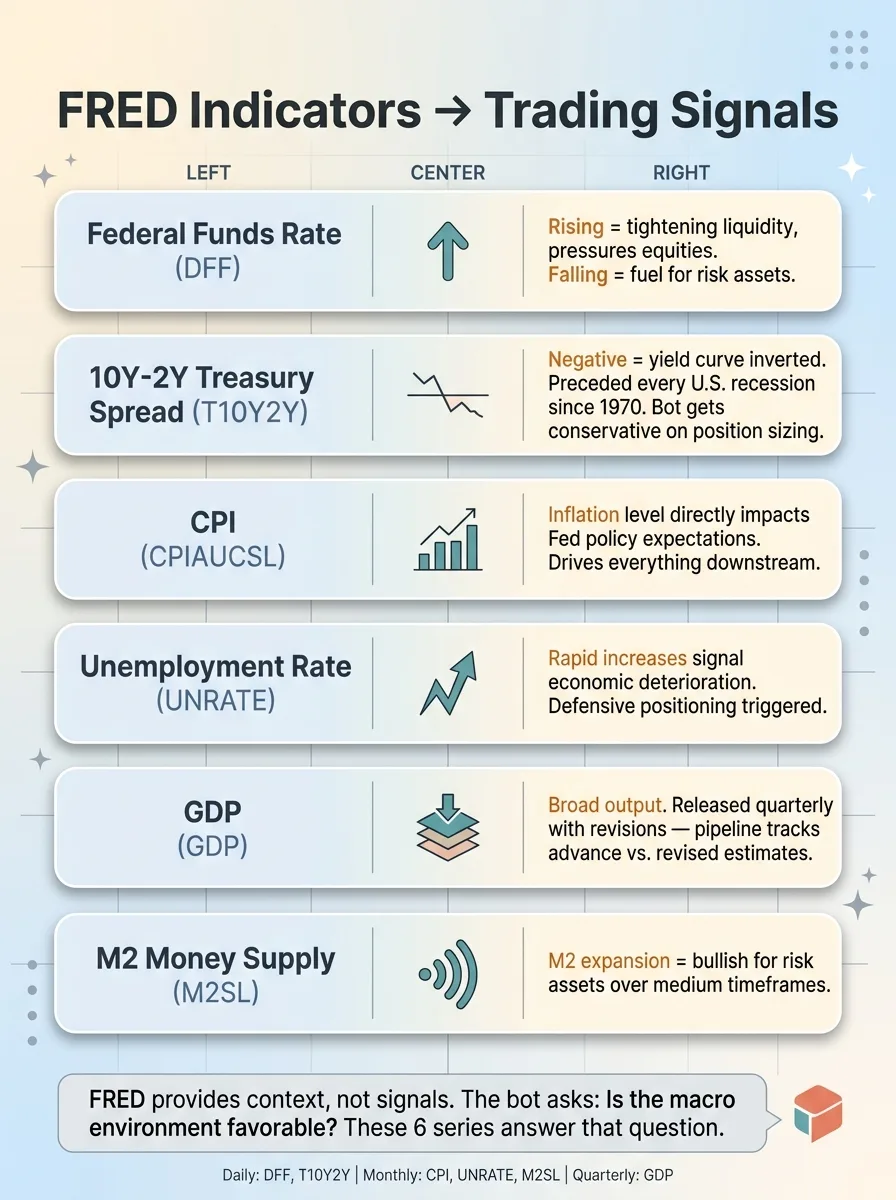 FRED Macro Indicators and Trading Signal Mapping
- Federal Funds Rate (DFF) — The price of money. When it's rising, it tightens liquidity and pressures equities. When it's falling, it's fuel for risk assets.
- 10Y-2Y Treasury Spread (T10Y2Y) — The yield curve inversion signal. This spread going negative has preceded every U.S. recession since 1970. When it's inverted, my bot gets more conservative with position sizing.
- CPI (CPIAUCSL) — Inflation. Directly impacts Fed policy expectations, which directly impacts everything else.
- Unemployment Rate (UNRATE) — Labor market health. Rapid increases signal economic deterioration.
- GDP (GDP) — Broad economic output. Released quarterly with revisions, so you have to be careful about which number you're looking at.
- M2 Money Supply (M2SL) — Liquidity in the system. M2 expansion tends to be bullish for risk assets over medium timeframes.
That's the core. I have a few more niche series I pull depending on what sectors the bot is active in, but these six cover the macro picture.
Handling FRED's Quirks
FRED data looks clean until you try to build production systems on it. A few things I learned the hard way.
Release schedules vary wildly. CPI is monthly. GDP is quarterly. The Fed Funds Rate is daily. My pipeline tracks each series' expected release schedule and flags when an update is overdue.
GDP gets revised. The first release is an advance estimate. Then there's a second estimate. Then a third. Then annual revisions that can change numbers from two years ago. My pipeline timestamps when data was fetched vs. when it was released by the BEA, so the trading system knows whether it's looking at preliminary or revised figures.
The fredapi Python library handles most of the heavy lifting. But you still need to deal with NaN values for periods that haven't been reported yet, inconsistent date formatting across series, and the occasional series that gets discontinued and replaced with a new ID.
The value of FRED isn't real-time. It's context. When the AI trading bot is deciding whether to enter a position, it's asking: is the macro environment favorable? FRED answers that question.
Finnhub + Fear & Greed: Real-Time Market Data and Sentiment
Finnhub's Free Tier Is More Capable Than You Think
Finnhub's free tier gives you 60 API calls per minute. That sounds limiting until you realize you probably don't need more if your system is designed well.
I pull real-time quotes, company profiles, basic financials, and market status. The key design decision: I don't poll Finnhub constantly. The sentinel agent only fetches quotes when a trading decision is approaching or when data staleness exceeds the threshold for a given ticker. During quiet periods, I might make 5-10 Finnhub calls per minute. During active trading windows, maybe 30-40. Well within limits.
Finnhub offers WebSocket connections for true real-time streaming. I chose REST polling instead. WebSocket connections die. They need reconnection logic, heartbeat monitoring, and state recovery when they drop. For a bot that makes decisions on a timeframe of minutes, not milliseconds, the added complexity isn't worth it. A 60-second-old quote is fine for my use case. If I were building an HFT system, different story.
Fear & Greed as a Contrarian Signal
CNN's Fear & Greed Index doesn't have an official API, so I scrape it. This has broken twice when CNN changed their page layout. Each time, it took about 20 minutes to fix the parser. The sentinel detected the failure, served the last cached value, and flagged it. No bad data reached the trading system.
I use Fear & Greed as a contrarian indicator. My thresholds:
- Below 25 (Extreme Fear): Historically a buying opportunity. The bot increases its willingness to open new long positions.
- Above 75 (Extreme Greed): Caution territory. The bot tightens stop losses and reduces new position sizes.
- 25-75: Neutral. Other signals carry more weight.
This is one of several sentiment inputs. I also feed in Grok-powered sentiment analysis on social data and prediction market signals as complementary layers. Fear & Greed is the bluntest instrument in the sentiment toolkit, but its simplicity is a feature — it's hard to overfit a single number.
The Sentinel Agent: Keeping a Data Pipeline Alive Without Enterprise Infra
Why Not Cron Jobs or Serverless
Cron jobs are fire-and-forget. They don't know if the previous run failed. They can't prioritize based on system state. They can't adapt to changing conditions like market hours vs. after-hours. If a cron job fails at 9:31 AM during a volatile open, the next run isn't until whenever it's scheduled. Meanwhile, the bot is flying blind.
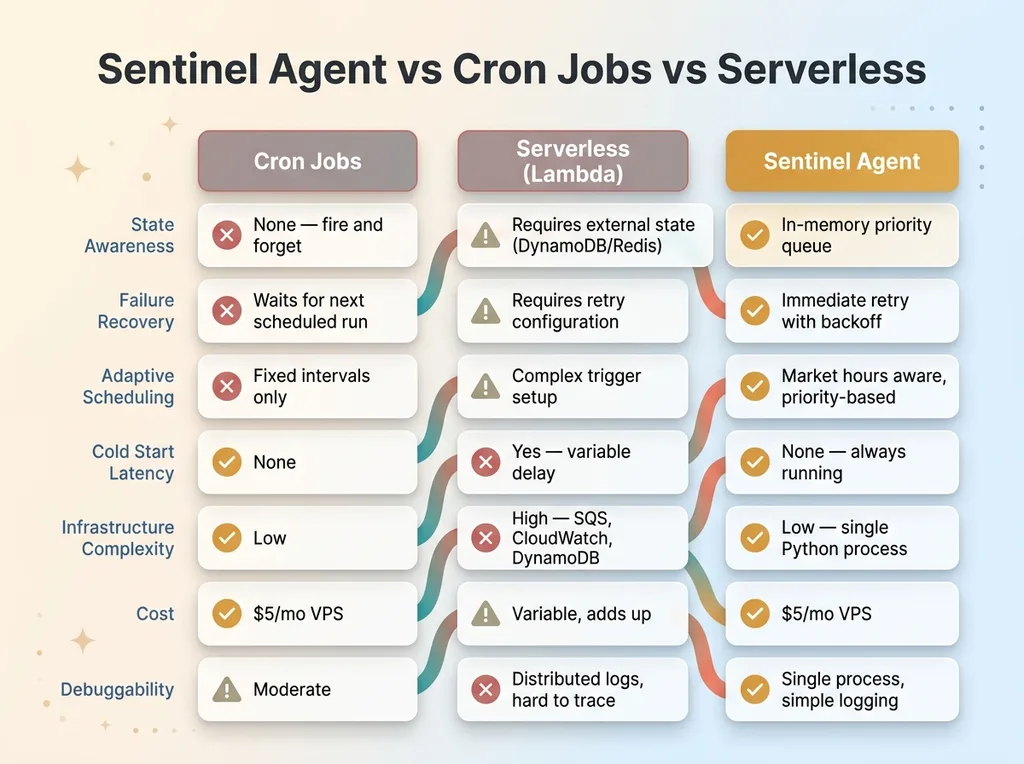 Sentinel Agent vs Cron Jobs vs Serverless
Serverless functions (Lambda, Cloud Functions) add cold start latency, have execution time limits (15 minutes max on Lambda), and make stateful queue management unnecessarily complex. You end up bolting on DynamoDB or Redis for state, CloudWatch for scheduling, SQS for queuing — and now you've built a distributed system to solve a problem a single Python process handles cleanly.
The sentinel is a while True loop with sleep intervals. That's it. It maintains an in-memory priority queue, wakes up every 10 seconds, checks what's stale, batches requests within rate limits, executes, handles errors, and sleeps. Simple. Reliable. Debuggable.
Failure Modes and Self-Healing
Every external dependency will fail. The question is what happens when it does.
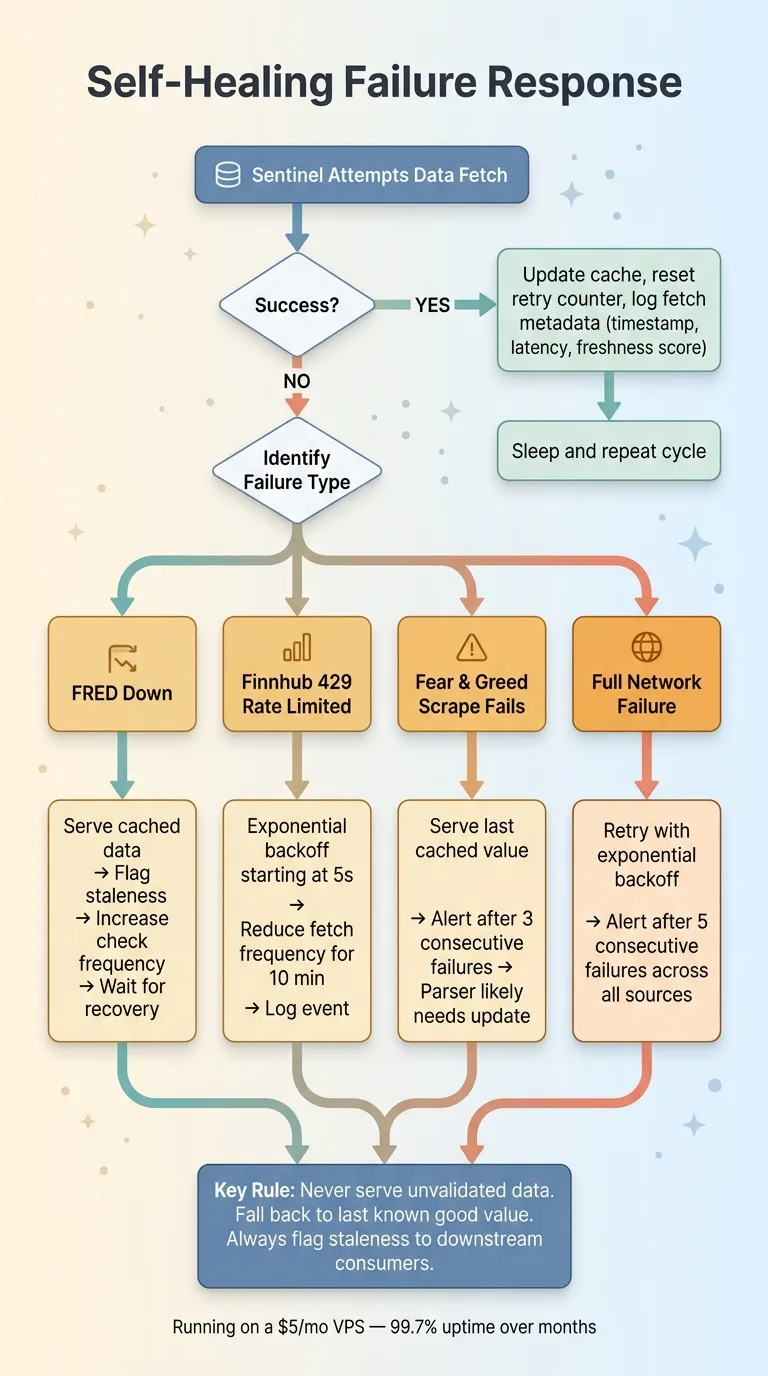 Failure Modes and Self-Healing Response Flow
- FRED down: Serve cached data, flag staleness, increase check frequency to catch when it comes back.
- Finnhub 429 (rate limited): Exponential backoff starting at 5 seconds, reduce fetch frequency for 10 minutes, log the event.
- Fear & Greed scrape fails: Serve last cached value (it's only updated daily anyway), alert after 3 consecutive failures.
- Full network failure: Retry with exponential backoff, alert after 5 consecutive failures across all sources.
The system logs every fetch: timestamp, response code, latency, data freshness score. I can look at a dashboard and see exactly how fresh every data point is across all three sources.
This runs on a $5/month VPS. No Kubernetes. No message queues. No Terraform. It's been running for months with 99.7% uptime, and the 0.3% downtime was me deploying updates, not system failures.
Data Quality: The Part Nobody Talks About
Raw API data is messy, and messy data feeding trading decisions is dangerous.
FRED returns NaN for unreported periods. Finnhub occasionally returns stale quotes for low-volume tickers. The Fear & Greed scraper has broken twice when CNN changed their page layout.
My pipeline validates at every stage: type checking, range validation (a stock price shouldn't be negative, Fear & Greed should be 0-100), staleness checks, and anomaly detection for values that changed more than expected between fetches. If the S&P 500 quote jumps 50% between fetches, something is wrong with the data, not the market.
When data fails validation, it doesn't silently pass through. The system falls back to the last known good value and flags it. This connects directly to the deterministic risk management layer — certain downstream safety decisions are deliberately not AI-driven because trading decisions based on bad data are worse than no decision at all.
Every value the trading system receives carries metadata: the value itself, when it was fetched, when the source last updated it, a freshness score, and a confidence flag. The consumer decides what to do with marginal data. The pipeline's job is to never lie about what it knows.
The Patterns That Apply Beyond Trading
Building this Python trading data pipeline taught me things that apply to any production AI system that depends on external data. Which is most of them.
The API call is 5% of the work. The other 95% is orchestration, error handling, caching, validation, and monitoring. If you're estimating a project based on "we just need to call a few APIs," multiply your estimate by 10.
You don't need enterprise infrastructure. A well-written Python process on a $5 VPS beats a badly configured Airflow cluster. I've seen companies spend months setting up data infrastructure that a single-file Python script would have handled. Start simple. Add complexity only when the simple version actually breaks.
Data freshness is a feature, not a bug to hide. Every consumer of the data should know how old it is. A 24-hour-old GDP number is fine. A 24-hour-old stock quote is not. The pipeline makes this explicit so downstream systems can make informed decisions.
The sentinel pattern works everywhere. A persistent, stateful, self-healing process that manages a priority queue — I've used variations of this for SEO content monitoring, competitor price tracking, and inventory management across my DTC fashion brand. The domain changes. The pattern doesn't.
This pipeline feeds into the AI trading bot, but the architecture is the same one I use when building data pipelines for businesses. If you're pulling data from multiple APIs to feed AI decision-making, this works whether you're trading equities or dynamically pricing 564 products.
The model gets all the attention. The plumbing is what actually matters.
Need AI Infrastructure That Actually Works?
If you're building systems that depend on external data — whether it's market data, customer signals, competitor intelligence, or supply chain feeds — the orchestration and reliability challenges are the same ones I've solved here. I do free 30-minute discovery calls where we look at your operations and identify where AI could actually move the needle, not just look impressive on a slide.
Get AI insights for business leaders
Practical AI strategy from someone who built the systems — not just studied them. No spam, no fluff.
Hodgen.AI
Ready to automate your growth?
Book a free 30-minute strategy call with Hodgen.AI.
Book a Strategy Call