SVG Infographics From Data: Visuals at Near-Zero Cost
How I generate 3-6 custom SVG infographics from data per blog post with almost no hosting cost. A three-track visual system for AI content.
By Mike Hodgen
Why Stock Images Make Your Content Look Like Everyone Else's
I run a content pipeline for a health brand that ships 3-5 posts a day. Every one of those posts needs visuals. Not decoration. Charts that carry data, hero images that set tone, callouts that pull a stat out of a wall of text. Generating distinctive SVG infographics from data turned out to be the only path that scaled without bankrupting me or making the content look like everyone else's.
 Three bad options for content visuals at scale
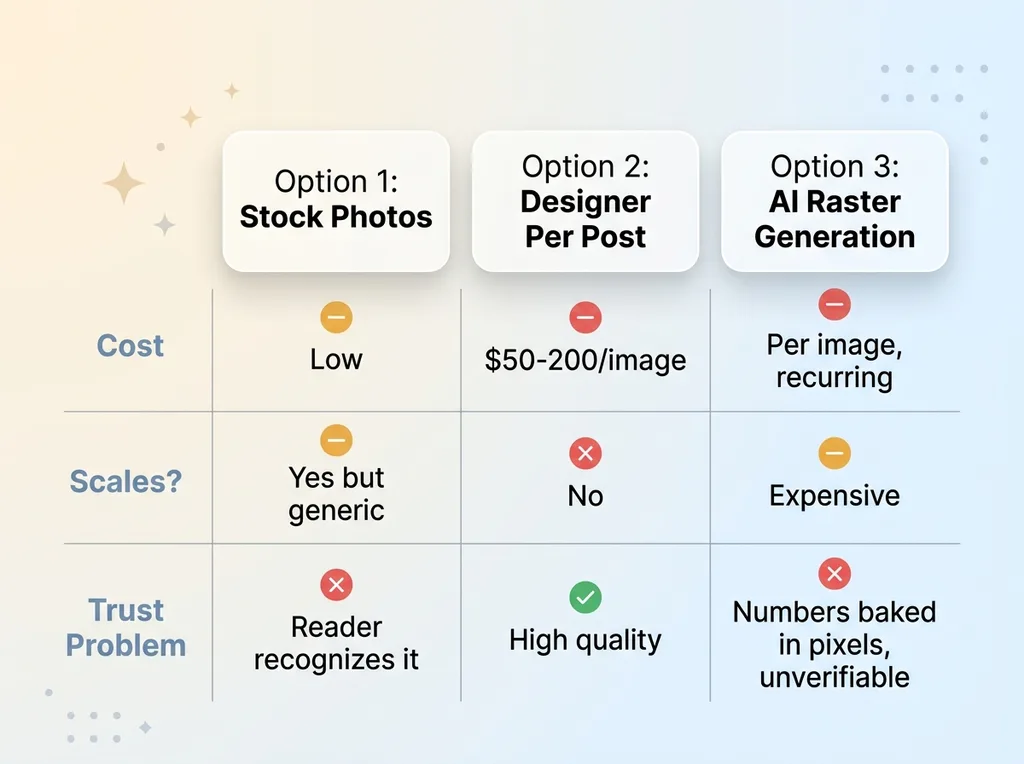
Here's the problem when you're publishing at that volume. You have three bad options.
Option one: stock photos. The issue is you can spot a Shutterstock image from a mile away. Your reader has seen that exact woman-smiling-at-laptop on forty other sites. The moment they recognize it, your content reads as low-effort. The image is supposed to build trust and it does the opposite.
Option two: a designer per post. Quality goes up, but so does the bill. At $50-200 per image and 15-30 visuals a day, the math falls apart before you finish the first week. It doesn't scale, and I needed something that did.
Option three: AI raster generation. This is the trap most people fall into right now. Every image costs money to generate. Every image needs hosting. Every image adds weight that slows your pages. And worst of all, when a chart is generated as a picture, the numbers are baked into pixels nobody can verify. The model will happily invent a figure and render it crisp and confident.
So I built something different. A three-track visual system where most visuals are native SVG generated at render time. No image file. The number gets passed in as data, the chart draws itself in the page, and the marginal cost per image is effectively zero.
That last part is the whole point. At my volume, "effectively zero" is the difference between a sustainable pipeline and a monthly invoice that grows with every post I publish.
The Three-Track Visual System, Explained
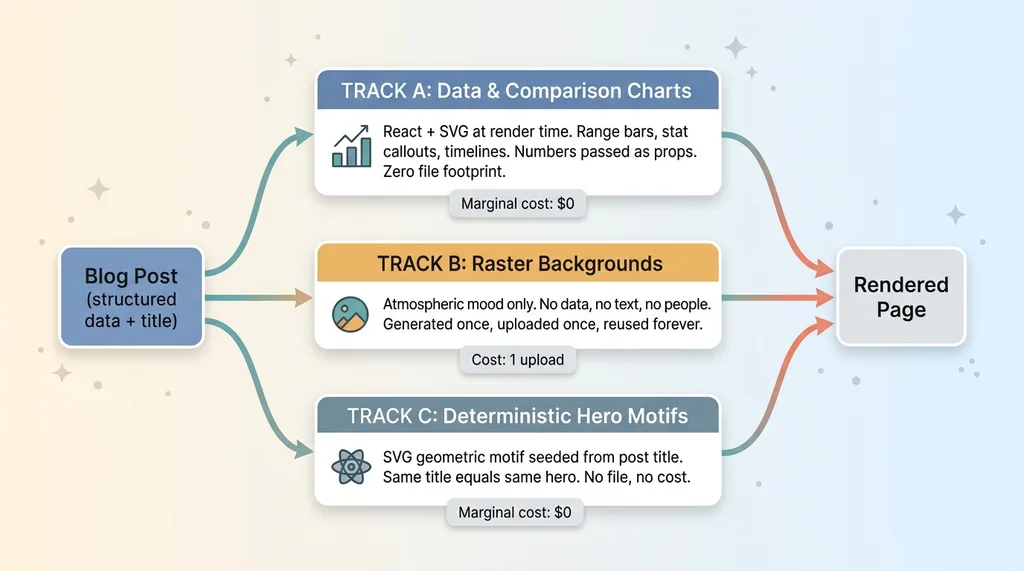
The architecture is simple once you see the split logic. Anything that carries data or text is SVG. Only mood and texture is raster. Three tracks, each with a clear job.
 The three-track visual system architecture
Track A: data and comparison charts
These are range-bar charts, stat callouts, and timelines. They're rendered as pure React plus SVG at render time. No image files exist anywhere. Every number is passed in as a prop, so the chart is a component that computes itself from structured data when the page loads.
If a post compares three treatment durations, that's a chart component receiving an array of values and a source citation. It outputs SVG directly into the page HTML. Nothing gets exported, nothing gets uploaded.
Track B: when raster actually earns its keep
Raster has exactly one job: atmospheric backgrounds. Texture, mood, a soft gradient field behind a hero. No data. No text. No people.
When I do use raster, it's generated once, uploaded to object storage one time, and never regenerated. The cost is a single upload that gets reused on every page view forever.
Track C: deterministic hero motifs
Most heroes never touch a raster pipeline at all. I built a deterministic generator that seeds an SVG geometric motif from the post title. The same title always produces the same hero. No file, no generation cost, no hosting. It's computed from a string.
The practical breakdown per post is 3-6 visuals. Maybe one raster background. The rest are SVG with zero file footprint. That ratio is what makes the whole thing cheap at the volume I described in overhauling content at scale.
How Charts Render From Data Without a Single Image File
Let me get concrete about Track A, because this is where most people assume you need a chart-as-image and you don't.
Every datum is a prop
A chart component takes structured data as props and outputs SVG inline in the page HTML. There's no PNG export step. There's no chart rendered to a canvas on the client and screenshotted. The data comes in, the SVG comes out, and it lives in the markup.
 SVG chart from data versus raster chart as image
That single design choice gives me four things for free.
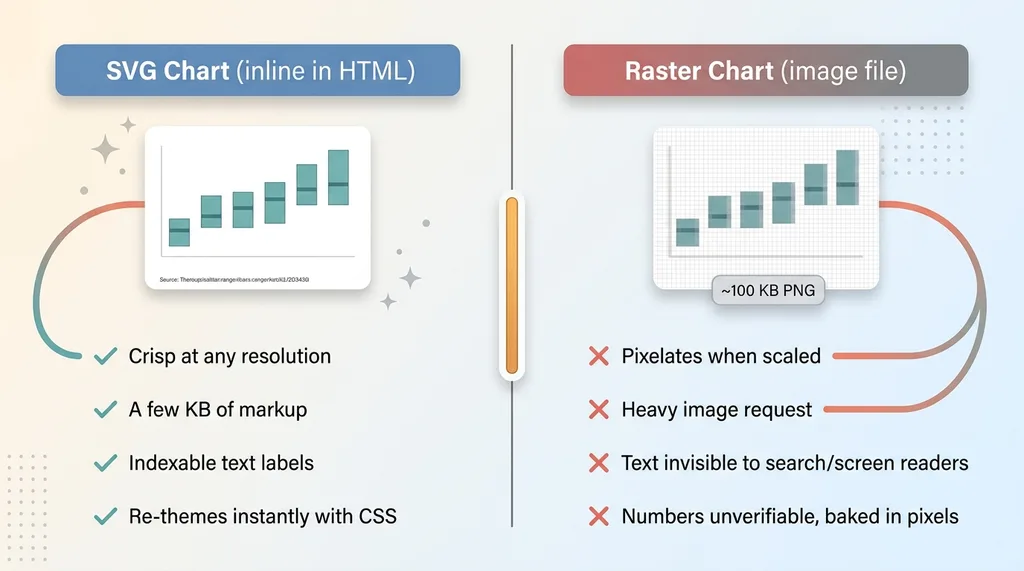
The charts are crisp at any resolution, because vectors don't pixelate. They're tiny in bytes, often a few kilobytes of markup instead of a hundred-kilobyte PNG. They're indexable text, so search engines and screen readers can actually read the labels. And they re-theme instantly with CSS, so when I update the brand palette every chart on the site changes with it.
Contrast that with the raster path, where a chart becomes an unverifiable picture. A flat image. You can't read it, you can't restyle it, and you can't check the numbers.
Why SVG beats a charting library here
People ask why I write the SVG myself instead of pulling in a heavy charting dependency. Two reasons.
Full control over style. My charts match the brand exactly because I drew them to. No fighting a library's defaults or shipping a bundle of features I don't use.
And the data binding stays explicit. I can see precisely which prop feeds which bar. That explicitness matters for the trust rule I'll get to in a second.
The byte weight matters too. I wrote about how I cut 92% off my site's image weight, and a big chunk of that came from never shipping a chart as a heavy image in the first place. An SVG chart that lives in the HTML doesn't even count as an image request.
The Rule That Keeps the Visuals Honest: No Source, No Chart
This is the part I'm proudest of, and it's the real trust differentiator.
 No source, no chart build-time enforcement rule
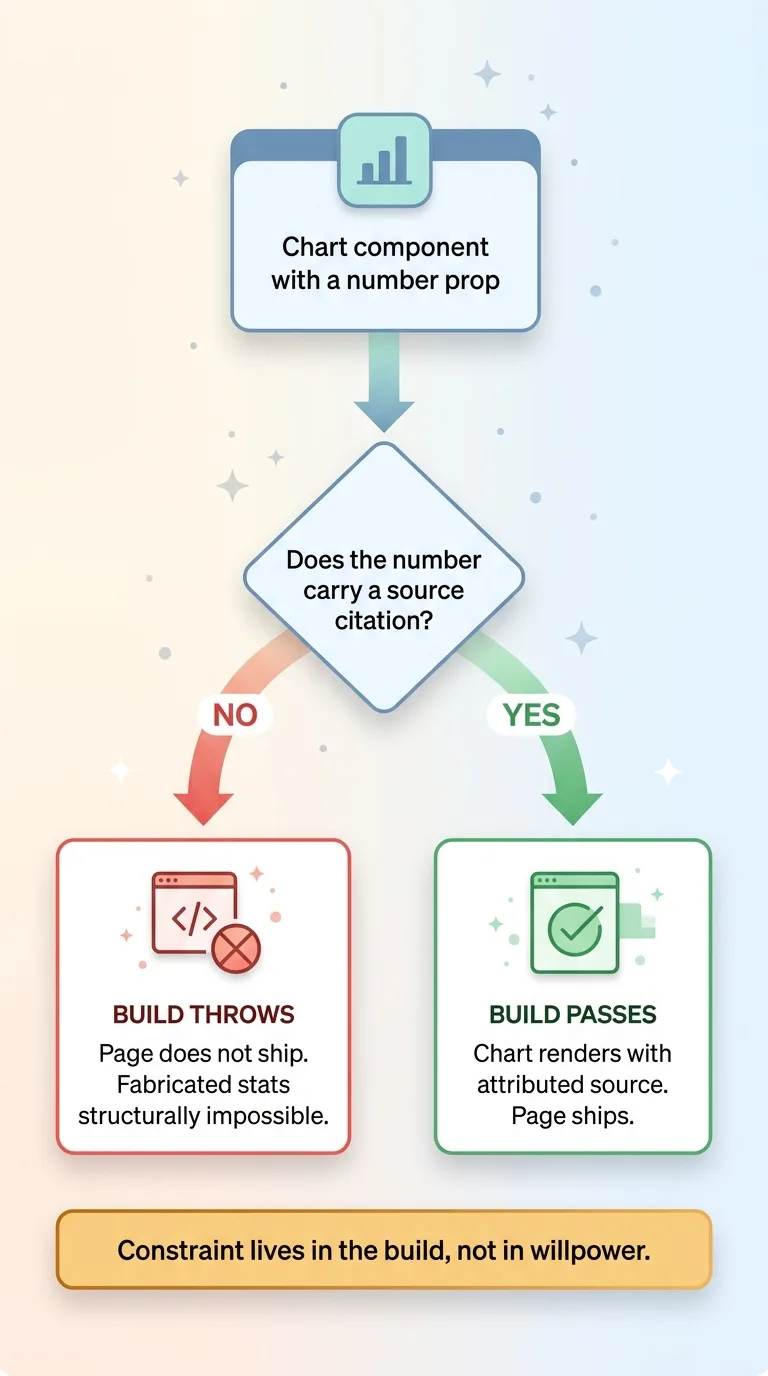
Every chart prop that carries a number must also carry a source citation. Not optional. If a chart component is built without a source, the build throws and the page doesn't ship. The pipeline refuses to publish a number it can't attribute.
That makes fabricated statistics structurally impossible inside a chart. The AI can't slip an invented figure past me because the system won't compile without a citation attached to that figure. The constraint lives in the build, not in my willpower to double-check every post.
In a regulated space like health content, that's not a nice-to-have. It's the difference between a publishable post and a liability. But it applies to any brand that cares about credibility. The moment a reader catches one made-up stat, every other number on your site is suspect.
Now contrast this with the raster path. When a number is baked into a pixel image, nobody can check it. The figure is part of the picture. And AI image models will invent figures with total confidence, rendering "73%" on a bar that corresponds to nothing.
This ties back to a principle I apply everywhere: constrain AI output at build time rather than trusting it at runtime. It's the same logic behind constraining what the AI is allowed to produce when generating product content. Don't ask the model to behave. Build a system where misbehaving fails the build.
Why I Never Bake Text Into a Raster Image
There's a practical reason and a strategic one, and they point the same direction.
The practical reason is that raster image models still mangle text. Garbled labels, misspelled words, characters that almost look right until you read them. Any image meant to carry words is a liability the moment you generate it. You'll get a beautiful chart with "Cholestrol" spelled wrong and a label that reads like alphabet soup.
So my raster track has hard rules. No people. No text. No product or medications shown. Atmospheric only. The raster layer carries mood and nothing else.
All text and data live in the SVG layer or the HTML. That's better for SEO and accessibility too. Text baked into a raster image is invisible to search engines and screen readers. A label in SVG is readable by both. So the same decision that keeps my visuals legible also keeps them indexable.
It future-proofs translation and theming as well. When the text is real text, I can translate it, restyle it, or update it without regenerating a single image.
This is the same principle I wrote about when explaining why AI can't reliably draw your product. Don't let the model draw the thing it can't get right. Let it do mood and texture, and handle the precise stuff with components you control.
The Cost Math: Near-Zero Marginal Visuals at Scale
Let me put real numbers on this, because the savings are the whole argument.
 Cost math: per-image raster bill versus near-zero SVG at scale
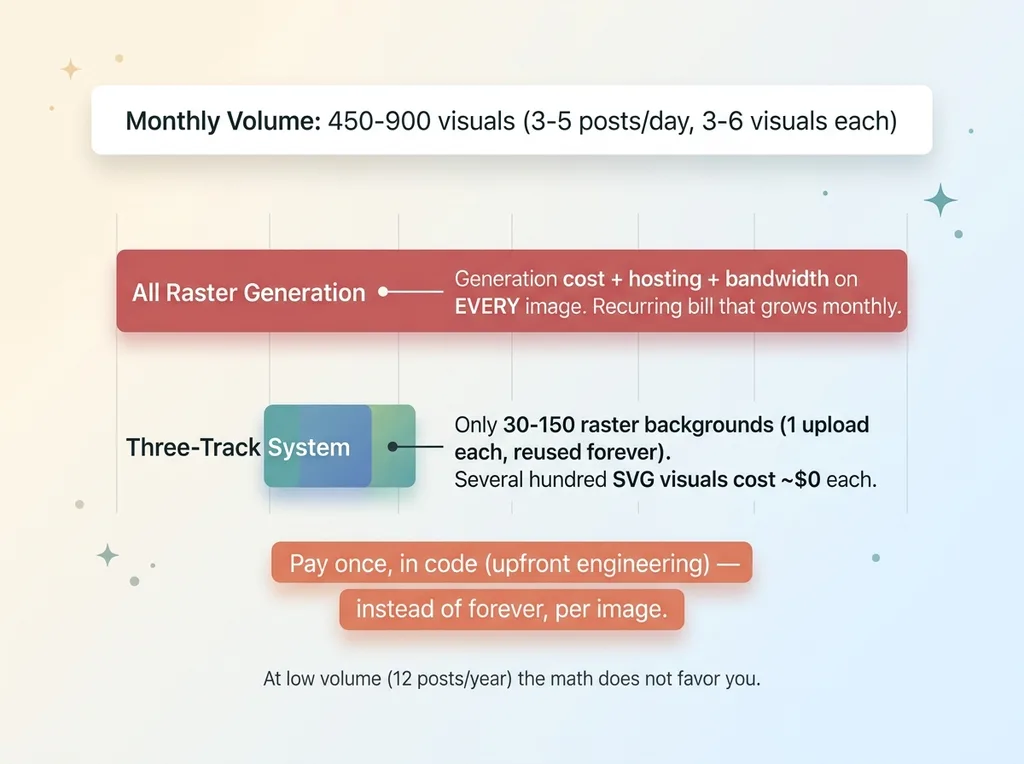
At 3-5 posts a day with 3-6 visuals each, I'm producing roughly 15-30 visuals daily. Call it 450-900 visuals a month.
If every one of those were a generated raster image, here's what I'd be paying. A generation cost per image. Hosting for every file. Bandwidth on every page view. And slower pages dragging down the metrics I actually care about. That's a recurring bill that grows every single month I keep publishing.
With the three-track system, most of those visuals are SVG with zero generation cost and zero hosting cost. They live in the page markup. They aren't files. There's nothing to host because there's nothing to store.
The raster track is one upload per post, reused forever. So instead of paying per image at 450-900 a month, I'm paying for maybe 30-150 raster backgrounds a month, uploaded once each, and the other several hundred visuals cost effectively nothing per unit.
Now the honest part, because I don't pretend anything is free.
Building the SVG component library took real upfront engineering. Writing the deterministic motif generator took real work. The raster track still costs something every time I generate a background. This isn't free. It's amortized.
I paid the cost once, in code, instead of paying it forever, per image. That's the trade. If you publish twelve posts a year, the math doesn't favor you. If you publish at volume, the upfront build pays itself back fast and then keeps paying.
Building a Visual System That Looks Designed, Not Generated
The doubt I hear from buyers is fair. How do you make AI content look professional and unique without paying for stock or a designer per post?
Here's the shift. You stop treating visuals as content you fetch and start treating them as components you compute.
A stock photo is something you go find. A generated raster is something you request and wait for. But a chart that draws itself from data, a motif seeded from a title, a background that follows a fixed rule set, those are computed. They come out consistent because the system that produces them is consistent.
That's why the output reads as deliberate and on-brand. Every chart shares a visual language. Every hero motif follows the same geometry. Every background obeys the same atmospheric rules. Nothing looks bolted on because everything came from one system.
This is the kind of decision a Chief AI Officer makes that a generic AI tool won't. The tool will hand you a prompt box and a per-image bill. The architecture is the product, not the prompt. Anyone can type a request into an image model. Building the system that makes the request unnecessary is the actual work.
And it's industry-neutral. I built this inside a regulated content pipeline where the source-citation enforcement was non-negotiable, but the same architecture works for any brand publishing at scale. The constraints get stricter in regulated spaces. The mechanics don't change.
If your content looks like everyone else's and your image bill keeps climbing, the fix usually isn't a better image model. It's a system that decides what should be computed versus fetched, and enforces the rules that keep it honest.
Want to explore what AI could do for your business?
Book a free 30-minute strategy call. No pitch deck, no sales team, just a real conversation about your operations and where AI actually fits.
Get AI insights for business leaders
Practical AI strategy from someone who built the systems — not just studied them. No spam, no fluff.
Hodgen.AI
Ready to automate your growth?
Book a free 30-minute strategy call with Hodgen.AI.
Book a Strategy Call