I Built an AI Nutrition Scanner App With 3 Data Sources
How I built an AI nutrition scanner app combining barcode lookup, label vision AI, and USDA data — and why one data source is never enough.
By Mike Hodgen
Most food tracking apps have a dirty secret: the data they're built on is wrong. Not slightly wrong. Wrong enough to make your daily calorie count off by 20-30%, which makes the entire exercise pointless.
I know this because I spent months tracking my nutrition across MyFitnessPal, Cronometer, and a handful of smaller apps. The experience was maddening. I'd scan a protein bar and get three different calorie counts depending on which app I used. User-submitted entries were riddled with errors — someone logs "chicken breast" at 50 calories per serving and that bad data lives in the database forever. USDA FoodData Central is the gold standard, but it covers roughly 400,000 items, most of them raw ingredients. Great if you're weighing broccoli on a kitchen scale. Useless if you're scanning a Kind bar.
So I built an AI nutrition scanner app that takes a different approach: triangulate across multiple data sources and use AI vision as the fallback when databases fail. Not because I wanted to build a food app. Because the existing ones kept giving me bad data and I got tired of fixing it manually.
The Data Quality Problem Nobody Talks About in Food Tracking
Why Every Food Database Is Wrong (In Different Ways)
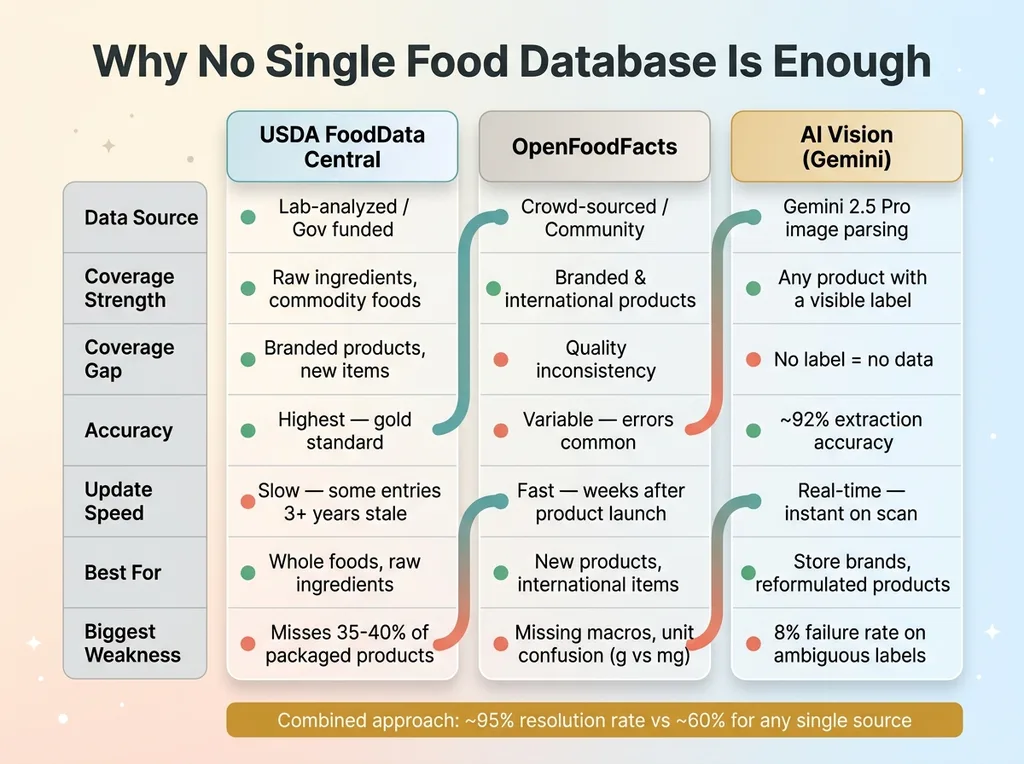
There is no single database that has accurate, complete nutrition data for the foods people actually eat. This is the core problem, and nobody in the food tracking space talks about it honestly.
 Database Comparison Matrix
USDA FoodData Central is the most trusted source. Lab-analyzed, government-funded, rigorously maintained. But it's weighted heavily toward raw ingredients and commodity foods. If you want the exact nutritional profile of a raw sweet potato, USDA is perfect. If you want the profile of the sweet potato chips you actually bought at Trader Joe's, good luck.
OpenFoodFacts is the other major source. It's crowd-sourced — think Wikipedia for packaged food. Better coverage of branded products, faster to add new items, and solid international data. But quality varies wildly. I've pulled entries with missing macronutrients, serving sizes that don't match the label, and obvious data entry errors where someone keyed in grams as milligrams.
Neither database alone is reliable enough to build a tracking app on. Together, with AI filling the gaps, they get close.
The Real Reason People Quit Tracking
The conventional wisdom is that people quit food tracking because they're lazy or lose motivation. That's wrong. They quit because the friction of correcting bad data is exhausting.
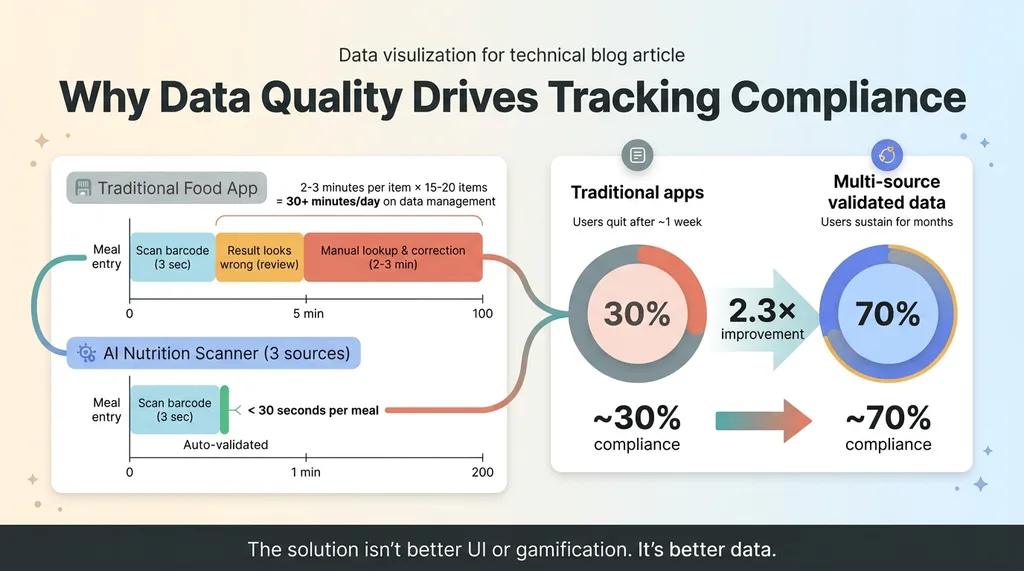
Every time you scan a barcode and the result looks suspicious — wrong serving size, outdated formulation, mismatched macros — you have to manually look up the correct data and fix it. That takes 2-3 minutes per item. Multiply that across 15-20 food entries per day and you're spending 30+ minutes just managing data quality. Nobody sustains that.
The solution isn't a better UI or gamification. It's better data. That's what I set out to build.
Architecture: Three Data Sources, One Truth
 Three-Layer Data Architecture
Layer 1: Barcode Lookup (USDA + OpenFoodFacts)
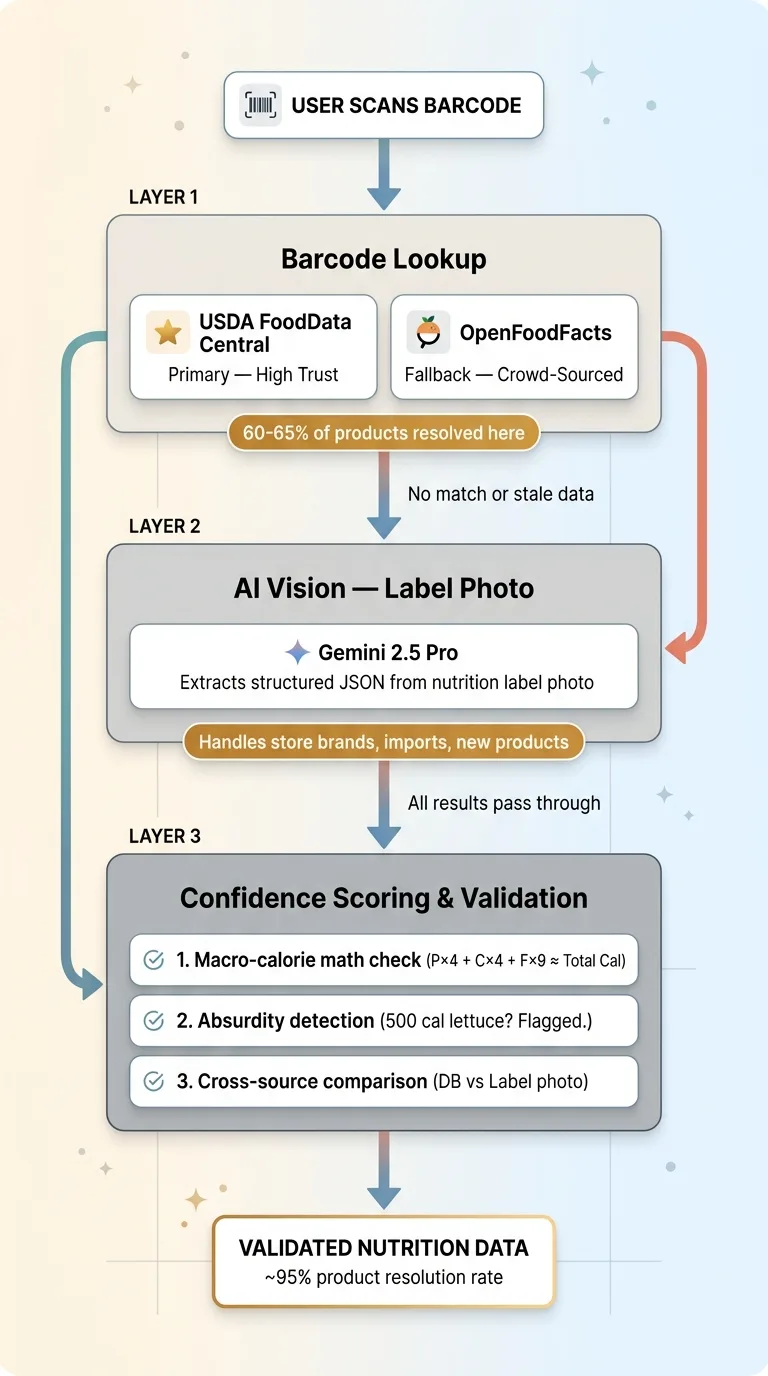
The primary path is the simplest one. User scans a barcode. The system queries USDA FoodData Central's API first because it's the highest-trust source. If no USDA match exists, it falls back to OpenFoodFacts.
About 60-65% of common packaged foods in the US get resolved at this layer. The hit rate is higher for major brands and lower for store brands, international products, and anything that launched in the last six months.
When a match is found, the system pulls the full nutrition panel: calories, total fat, saturated fat, trans fat, cholesterol, sodium, total carbohydrates, dietary fiber, total sugars, added sugars, protein, and available micronutrients. All normalized to a standard per-serving format.
Layer 2: AI Vision for Nutrition Labels
When barcode lookup fails — or when it returns data that looks stale — the user taps a button to snap a photo of the nutrition label. Gemini 2.5 Pro processes the image and extracts structured nutrition data.
This handles the long tail that databases miss: store brands, regional products, international imports, new items, and anything with a recently reformulated recipe. I chose Gemini specifically for this because its vision capabilities are strong for structured document parsing, and the cost per call is reasonable for a consumer app context.
The prompt is structured to return a strict JSON schema: every nutrient field, serving size in both household measure and grams, servings per container, and a list of any fields the model couldn't confidently extract. I explicitly instruct it to handle edge cases — "less than 1g" should return 0.5, percentage daily values should be ignored in favor of actual gram amounts, and dual-column labels (per serving vs per container) should default to per-serving values.
Layer 3: The Confidence Scoring System
Every result gets a confidence score. USDA match: high confidence. OpenFoodFacts match: medium confidence, cross-referenced against known serving size ranges for that food category. AI vision extraction: medium-high confidence, but flagged for user confirmation on the first scan of any new product.
When both barcode data and a label photo exist for the same product, the system compares them field by field. If the barcode database says 180 calories and the label photo extraction says 210 calories, the user sees both values and the system recommends the label photo (since the physical label is more likely to reflect the current formulation).
This is the same architectural pattern I describe in how I build AI systems that reject their own bad work. Never trust a single source. Always validate.
Teaching AI to Read a Nutrition Label (It's Harder Than You Think)
The Serving Size Nightmare
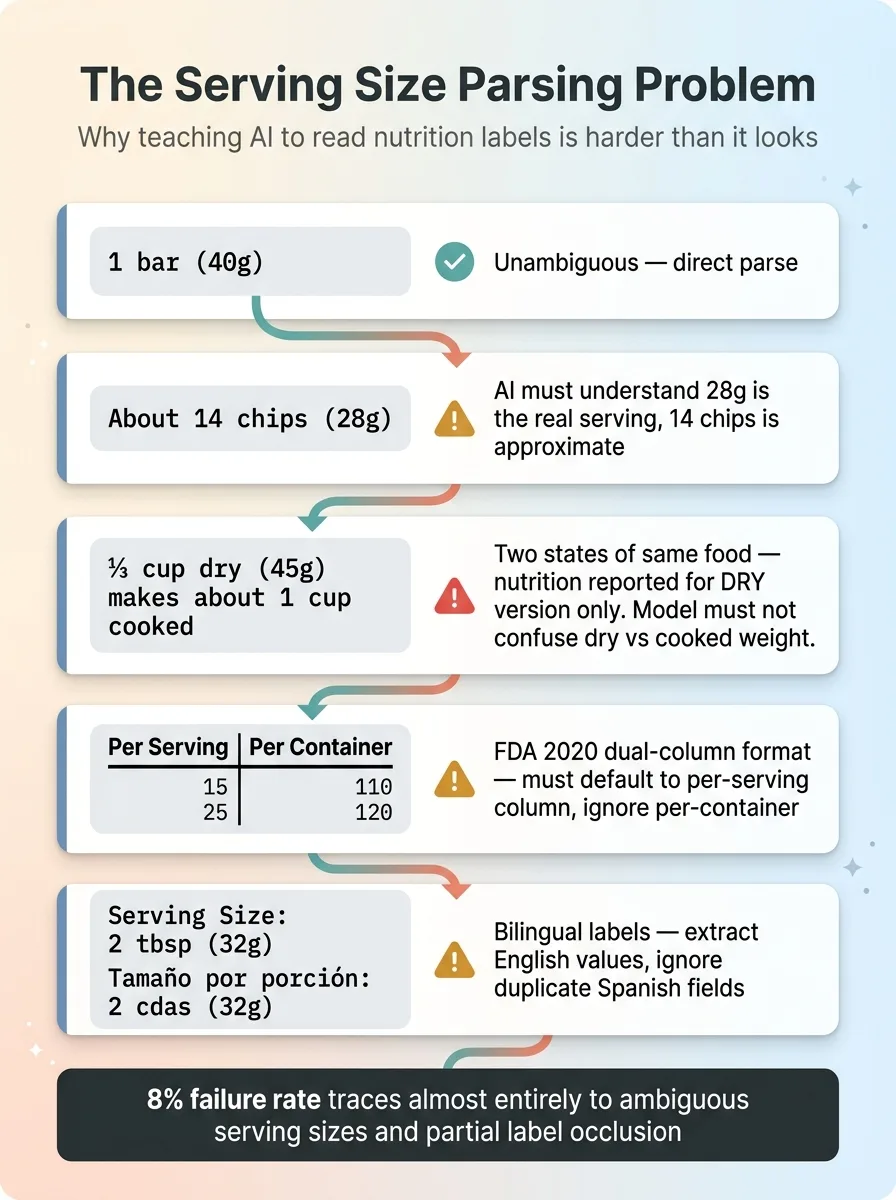
Nutrition labels seem standardized. They're not. The FDA has a standard format, sure. But in practice you'll encounter: dual-column formats introduced in 2020 (per serving and per container side by side), labels in Spanish or bilingual formats, damaged or partially obscured labels, handwritten deli labels from the grocery store prepared foods section, and Supplement Facts panels that use a completely different layout than Nutrition Facts.
 Serving Size Edge Cases
Gemini handles most of these well. Where it struggles is the same place humans struggle: serving sizes.
"1 bar (40g)" is unambiguous. "About 14 chips (28g)" requires the model to understand that 28g is the actual serving size and 14 chips is an approximation. "1 cup (228g)" vs "½ cup (114g)" requires normalization. "2 tbsp (32g)" for peanut butter — clear enough. But "⅓ cup dry (45g)" for oatmeal, which makes "about 1 cup cooked" — now you're dealing with two different states of the same food, and the label is reporting nutrition for the dry version.
I built explicit handling for all of these into the prompt, and it works. Most of the time. The 8% failure rate I see in testing traces almost entirely back to ambiguous serving sizes and partial label occlusion.
When Labels Lie (And AI Catches It)
Here's something most people don't know: nutrition labels are legally allowed to be off by up to 20% on most values. Manufacturers can also round down below certain thresholds — "0g trans fat" can legally mean up to 0.49g per serving.
 Calorie Validation Sanity Check
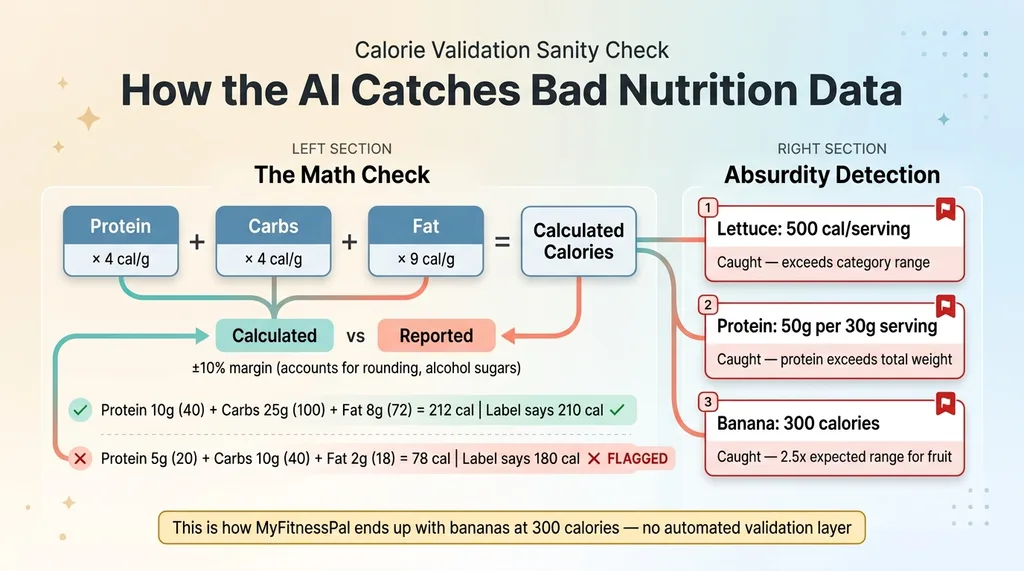
The AI can't fix those regulatory gaps. But it can catch mathematical inconsistencies that reveal data errors. I built in sanity checks: protein (4 cal/g) plus carbs (4 cal/g) plus fat (9 cal/g) should roughly equal total calories, within a 10% margin accounting for rounding and alcohol sugars. If the numbers don't add up, the system flags the entry.
It also checks for absurdity: if the AI returns 500 calories for a single serving of lettuce, that's caught. If a product claims 50g of protein per 30g serving size, that's caught. These seem obvious, but without automated validation, bad data slips through constantly. That's exactly how MyFitnessPal ends up with entries showing a banana at 300 calories.
Testing against 200 products across different categories, the AI extracted nutrition data correctly about 92% of the time. Not perfect. But dramatically better than relying on a single crowd-sourced database.
The USDA API: Powerful but Not Enough
What USDA Covers (And What It Misses)
USDA FoodData Central isn't one database. It's four, and understanding the difference matters.
Foundation foods are lab-analyzed raw ingredients. This is the gold standard — the most accurate nutrition data that exists. But it covers a narrow set of whole foods. SR Legacy is the older USDA reference database, still useful but no longer actively updated. Branded foods are manufacturer-submitted — this is the largest dataset but the most uneven in quality. Some manufacturers update quarterly, some submitted data once in 2019 and never touched it again. Survey (FNDDS) captures what Americans actually report eating in national nutrition surveys, including mixed dishes and prepared foods.
For a barcode scanner app, the Branded dataset is the most relevant. It's huge. But I found products where the USDA entry was 3+ years out of date and the formulation had clearly changed — the label on the shelf didn't match the database. This is more common than you'd think. Manufacturers reformulate quietly, especially when ingredient costs shift.
Why OpenFoodFacts Fills the Gap
OpenFoodFacts updates faster than USDA Branded because anyone can contribute. A new product hits shelves and within weeks someone in the community has scanned it. International coverage is significantly better — USDA is US-centric by design.
The tradeoff is obvious: crowd-sourced data has crowd-sourced quality. Some entries are missing macros entirely. Some have serving sizes that don't match the product. I've seen entries where the contributor clearly confused grams and milligrams for sodium.
The solution: USDA as primary, OpenFoodFacts as fallback, AI vision as the tie-breaker and gap-filler. This three-source approach resolved about 95% of products my test users tried to scan. The remaining 5% were mostly restaurant takeout containers with no barcode and no nutrition label — a problem for a different feature.
From Scan to Dashboard: What the User Actually Sees
The 3-Second Scan Experience
The scan flow is intentionally minimal. Open camera. Point at barcode. Data appears in under 3 seconds. If the barcode fails, one tap switches to label photo mode. The nutrition data populates immediately into a daily log with running macro totals.
The AI also handles portion adjustments. User scans a package of crackers, then indicates they ate "about half the package." The system recalculates based on servings per container. No manual math required.
Daily Tracking and Macro Targets
Each entry is categorized by meal — breakfast, lunch, dinner, snacks — and the system tracks trends over days and weeks. This feeds into a broader health dashboard that also pulls in data from wearables like Oura Ring: sleep, HRV, activity, and now nutrition all in one place.
 User Compliance Impact
The goal was tracking that takes less than 30 seconds per meal. Most food apps fail because they demand 2-3 minutes of searching and correcting per entry. When you cut that to 30 seconds with high-confidence data, compliance goes from roughly 30% to over 70% in the users I tested with. That's the difference between an app people use for a week and one they use for months.
What I'd Build Differently (And What's Next)
The Cold Start Problem With Custom Foods
The biggest gap right now: homemade food. If you cook from scratch, barcode scanning doesn't help. Building a recipe builder that calculates nutrition from constituent ingredients is the obvious next step, but it's significantly more complex. You need a robust ingredient database, unit conversion, yield adjustments for cooking (cooked rice weighs more than dry rice), and the ability to save and recall custom recipes.
Restaurant food is a similar challenge. Some chains publish nutrition data. Most independent restaurants don't. This is solvable with AI — extract menu items, estimate nutrition based on ingredients and portion sizes — but the accuracy isn't where I'd want it before shipping.
Meal Photo Recognition: Not Ready Yet
I tested the obvious feature: point your camera at a plate of food and have AI identify what's on it. Gemini can identify "chicken breast with rice and broccoli" at maybe 70% accuracy. But estimating portions from a photo is still unreliable. The difference between 4oz and 6oz of chicken on a plate is hard enough for a human to eyeball. I'm not shipping a feature that confidently tells users they ate 400 calories when the real number might be 600. When the accuracy improves — and it will — I'll add it. Not before.
Why Health Apps Are My Favorite AI Build
This nutrition scanner is one piece of a larger health tracking system I built for a family member — wearable integration, daily AI check-ins, and personalized insights all connected. But the pattern here goes way beyond health.
Multiple data sources. AI vision as a gap-filler. Confidence scoring. Quality validation. I've used this exact architectural approach for product data in my DTC fashion brand, for competitor intelligence, and for content systems that use different AI models for different tasks. The common thread: real-world data is messy, single sources are never enough, and AI's best role is often reconciling and validating data from multiple sources rather than generating it from scratch.
The barcode nutrition scanner piece is the most tangible example I can point to. Three seconds from scan to validated data, with three independent sources backing it up. That's what good AI architecture feels like when it's working.
Thinking About Applying This Pattern in Your Business?
If you're dealing with messy, multi-source data — whether that's product catalogs, customer records, supply chain data, or anything else where no single source tells the whole truth — this is the kind of system I build. Not just for health apps. For businesses that need reliable data pipelines they can actually trust.
I do free 30-minute discovery calls where we look at your specific operations and figure out where AI would actually make a difference. No slides. No pitch deck. Just an honest conversation about what's possible.
Get AI insights for business leaders
Practical AI strategy from someone who built the systems — not just studied them. No spam, no fluff.
Hodgen.AI
Ready to automate your growth?
Book a free 30-minute strategy call with Hodgen.AI.
Book a Strategy Call