Core Web Vitals: Lab vs Field (My Day Wasted)
I cut my homepage image weight in half before checking core web vitals lab vs field data. The real-user numbers said I fixed the wrong thing.
By Mike Hodgen
The Speed Tools All Said the Same Thing (And They Were All Wrong)
A few months back I ran my DTC fashion brand's homepage through a speed test on a slow morning. Pingdom gave it a D. Lighthouse came back with a throttled LCP around 2.9 seconds. GTmetrix agreed. Every tool I threw at it pointed at the same villain: image weight.
 Lab Data vs Field Data comparison
The number was ugly. 22.5MB of images downloading on mobile. For a handmade fashion brand based in San Diego, where the product photos are the whole pitch, that felt like a real problem.
The instinct here is obvious. Cut the images, fix the score, move on. I've cut image weight before. I've done it at scale. So I rolled up my sleeves and spent a full day doing exactly that.
Here's what I didn't do until the end of that day: check the one number Google actually ranks on.
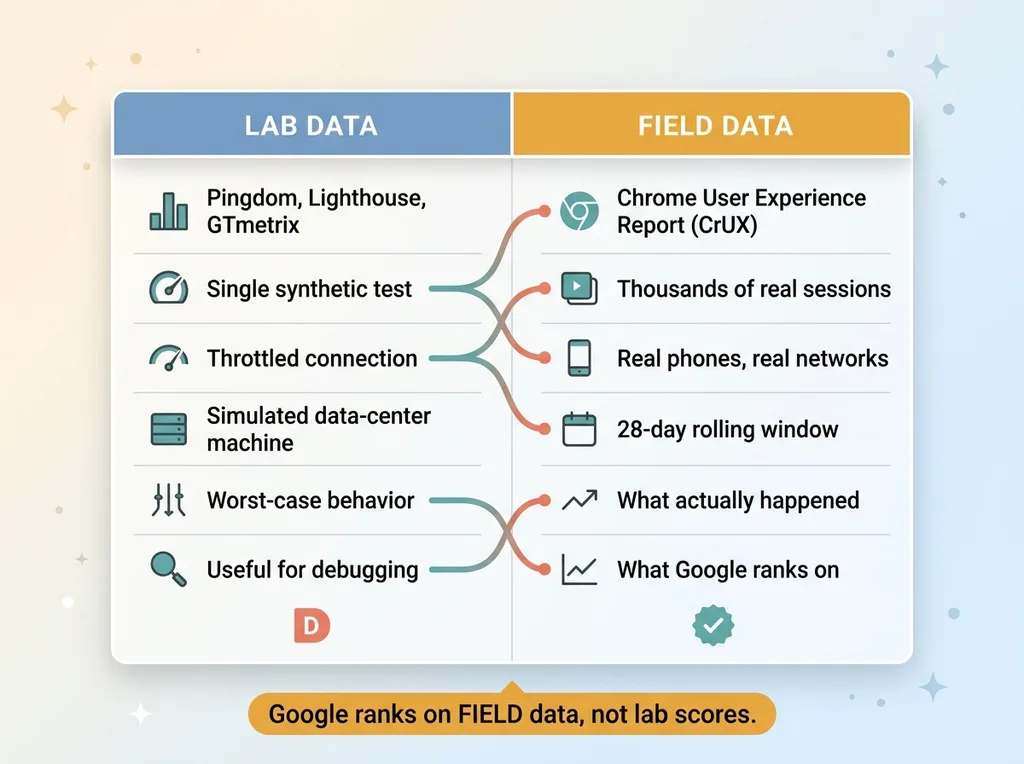
That's the trap of the whole core web vitals lab vs field distinction. Pingdom, Lighthouse, GTmetrix are all lab tools. They run a single synthetic test on a throttled connection in a simulated environment. They're useful for debugging. They are not what Google uses to rank your site.
Google ranks on field data. Real visitors, real phones, real networks. And those can tell a completely different story than the scary letter grade.
I didn't know that gap mattered yet. So I spent a day fixing a problem I didn't have, and I'm going to walk you through every step of it, because the lesson is worth more than the wasted hours cost me.
What I Did: A Full Day of SEO-Safe Image Cuts
The image work itself was clean. I want to be clear about that. The problem wasn't that I did it badly. The problem was that I did it at all.
Eager to lazy, with a gate
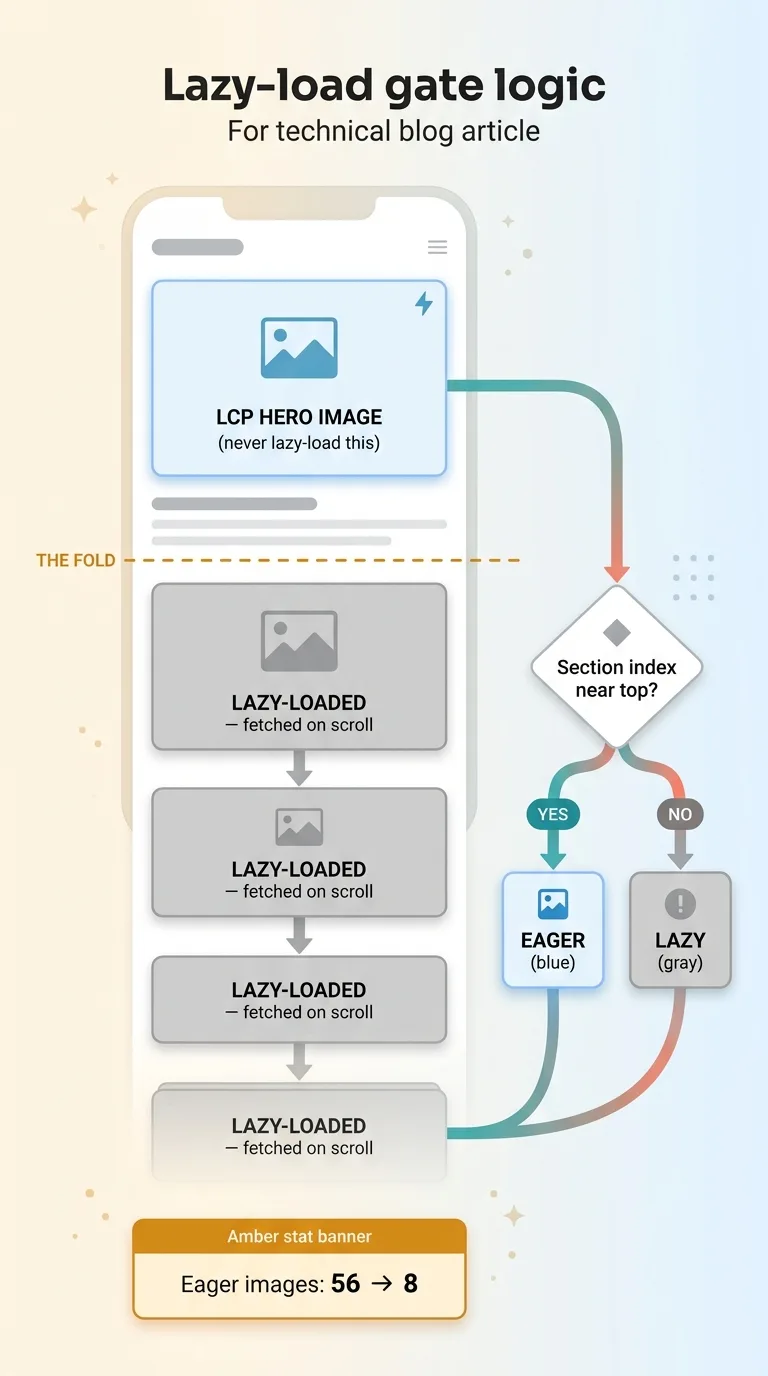
By default the theme was eager-loading a pile of images, meaning the browser fought to download all of them at once on page load. The fix is to lazy-load anything below the fold so it only fetches when the visitor scrolls near it.
 The lazy-load gate logic (eager vs lazy with above/below fold)
But you never lazy-load your LCP element. The hero image at the top of the page is the thing Google measures for Largest Contentful Paint, and if you defer it, you tank the exact metric you're trying to protect. So I built a gate: above-the-fold images stayed eager, everything below switched to lazy.
Eager images dropped from 56 down to 8. That alone was a meaningful change in how the page loaded.
Mobile sizing the right way
The second piece was the sizes attribute. Without it, a phone can pull a desktop-sized image and shrink it down in the browser, wasting bandwidth on pixels nobody sees. I added proper 50vw sizing hints so phones request appropriately small images.
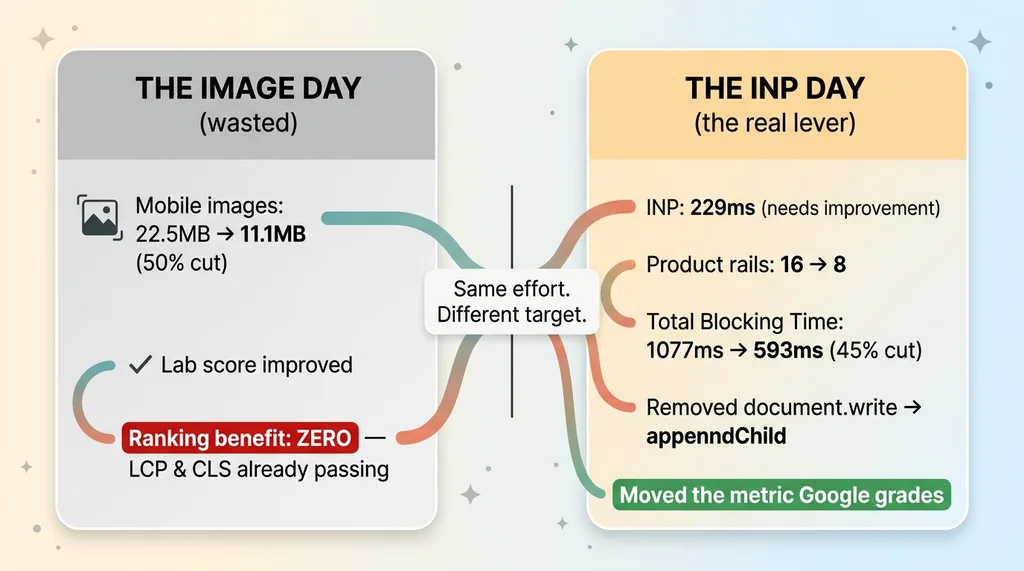
Mobile image download fell from 22.5MB to 11.1MB. A clean 50% cut.
On paper this is a win. The lab scores improved. If you want the deeper technical playbook on this, I've written about how I cut 92% off my site's image weight across the full product catalog, and every technique there is sound.
The work was correct. The targeting was wrong. I'd just spent a day solving a problem that, as I'd find out, was never costing me anything.
The Render-Scope Gotcha That Almost Made It All a No-Op
Here's a detail that almost turned the whole day into nothing, and it's the kind of silent failure that wastes weeks if you don't catch it.
The lazy-load gate depended on knowing each section's index on the page. The logic was simple: if a section sits at the top, keep it eager. If it's further down, lazy-load it. To make that decision, the code needed to know where on the page each section lived.
The problem is that the template language I was working in uses a scope-isolated render tag. When you render a snippet, it doesn't automatically inherit the variables from the page around it. The section index variable I was relying on simply didn't exist inside the rendered snippet unless I explicitly passed it in.
If I hadn't caught that, the gate would have had no index to check. The lazy-load logic would have silently done nothing. Every image would have stayed eager. The optimization would have appeared shipped, the code would have looked correct in review, and the actual behavior would have been zero change.
I caught it. I passed the index in explicitly. The gate started working and the scores moved.
But sit with that for a second. I almost shipped a broken optimization that looked completely fine. The code was there. The PR was clean. It just didn't do anything. This is the failure mode nobody warns you about, and it's why I measure outcomes and not just whether the code merged.
Then I Pulled the Field Data and Felt Stupid
At the end of the day, feeling good about my 50% image cut, I finally pulled the number I should have started with.
What CrUX actually measures
Google ranks on the Chrome User Experience Report. CrUX field data is collected from real Chrome users who opt in, across real devices and real network conditions, on a 28-day rolling window. It's the aggregate of what your actual customers experienced when they loaded your site.
That's the difference. Lab data is one synthetic throttled run on a machine in a data center. Field data is thousands of real sessions on real phones on real cell networks. When people talk about CrUX field data, this is it, and it's the data Google's ranking systems actually consume.
A lab tool can show you a D while your field data is green. That's not a contradiction. They're measuring different things. Lab tells you what could go wrong under a worst-case synthetic test. Field tells you what did happen to your visitors.
My origin already passed
So I pulled my origin's field data. Here's what I found.
 Core Web Vitals thresholds and where the brand actually stood
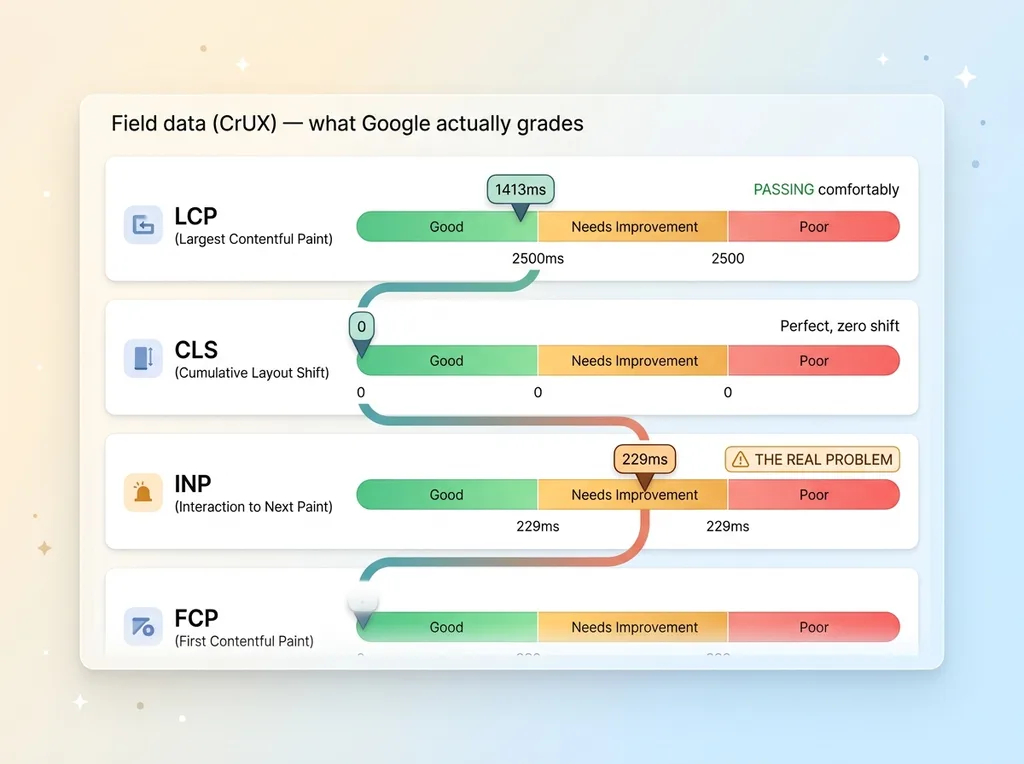
LCP was 1413ms. The "good" threshold is 2500ms. I was passing comfortably, almost a full second under.
CLS was 0. Cumulative Layout Shift, the metric for how much your page jumps around as it loads, was perfect. Zero shift.
Let that land. The two metrics every speed tool screamed about, the ones tied to my image weight, were already passing in the field. My real customers, on their real phones, were getting a fast-loading page with stable layout.
The 22.5MB was never costing me rankings. The lab throttle made it look catastrophic. The field said it was a non-issue.
I'd spent a full day chasing a vanity number while the metric Google grades was already green. That's the lighthouse score misleading problem in one painful example.
The Real Gap Was INP, Not Images
The field data didn't just clear me on images. It pointed at the thing that was actually wrong, and it was a metric not one of my speed tools had flagged.
 The wasted image day vs the INP fix that actually mattered
Interactivity, not download size
INP was sitting at 229ms, squarely in the "needs improvement" band. My FCP was a little soft too.
INP stands for Interaction to Next Paint. It measures how fast your page responds when someone taps a button, clicks a link, opens a menu. It's not about how fast the page downloads. It's about how fast the page reacts once a real person touches it.
This is invisible to an image audit. You can compress every image on the page to nothing and your INP won't budge, because INP is a main-thread problem, not a bandwidth problem. When INP optimization on Shopify or any platform is your real issue, no amount of image cutting touches it.
What doubling my sections cost me
The cause was something I'd done weeks earlier and felt good about at the time. I'd doubled my homepage from 7 sections to 15. More product rails, more collections, more stuff to show off.
Every new section added JavaScript hydration. Each interactive widget needs the browser to wire up its event handlers, and that work piles onto the main thread. More widgets means more main-thread work, which means slower response when someone taps. The "fuller" homepage felt richer to me and felt laggier to my customers.
INP became an official Core Web Vital in 2024, replacing FID. And it punishes exactly this kind of section-stuffing. The thing I did to make the homepage feel more complete was the thing degrading the metric Google actually grades.
Nobody's speed tool caught it. They were all busy yelling about images.
Fixing the Lever That Actually Moved
Once I knew the real lever, the fix was faster than the wasted day.
I trimmed product rails from 16 down to 8. Half the homepage. It still showcased the brand, it just stopped drowning the main thread in hydration work for rails most visitors never scrolled to.
Total Blocking Time dropped from 1077ms to 593ms. That's a 45% cut, and I didn't trust a single run to tell me that. I A/B measured it, multiple loads before and after, because one Lighthouse run is noise. Measuring the swing properly is the whole point.
Then I found a document.write call buried in a script. document.write blocks the parser dead while it runs, which is poison for interactivity. I swapped it to appendChild. Small change, real impact on how fast the page becomes responsive.
Here's the part that should sting if you've ever burned a day on the wrong fix. This work, the work that targeted the number Google actually grades, took less time than the image day did. The image day produced a prettier lab score and zero ranking benefit. The INP day moved the metric that matters.
The discipline is simple to state and apparently hard to follow, including for me: measure your field data first, find the actual gap, fix that. When I built a way to centralize analytics into one dashboard, this was the lesson driving it. You can't fix the right thing until you're measuring the right thing.
Before You Optimize, Measure the Thing That's Graded
Let me answer the question you're actually asking, because I see this doubt in every CEO conversation.
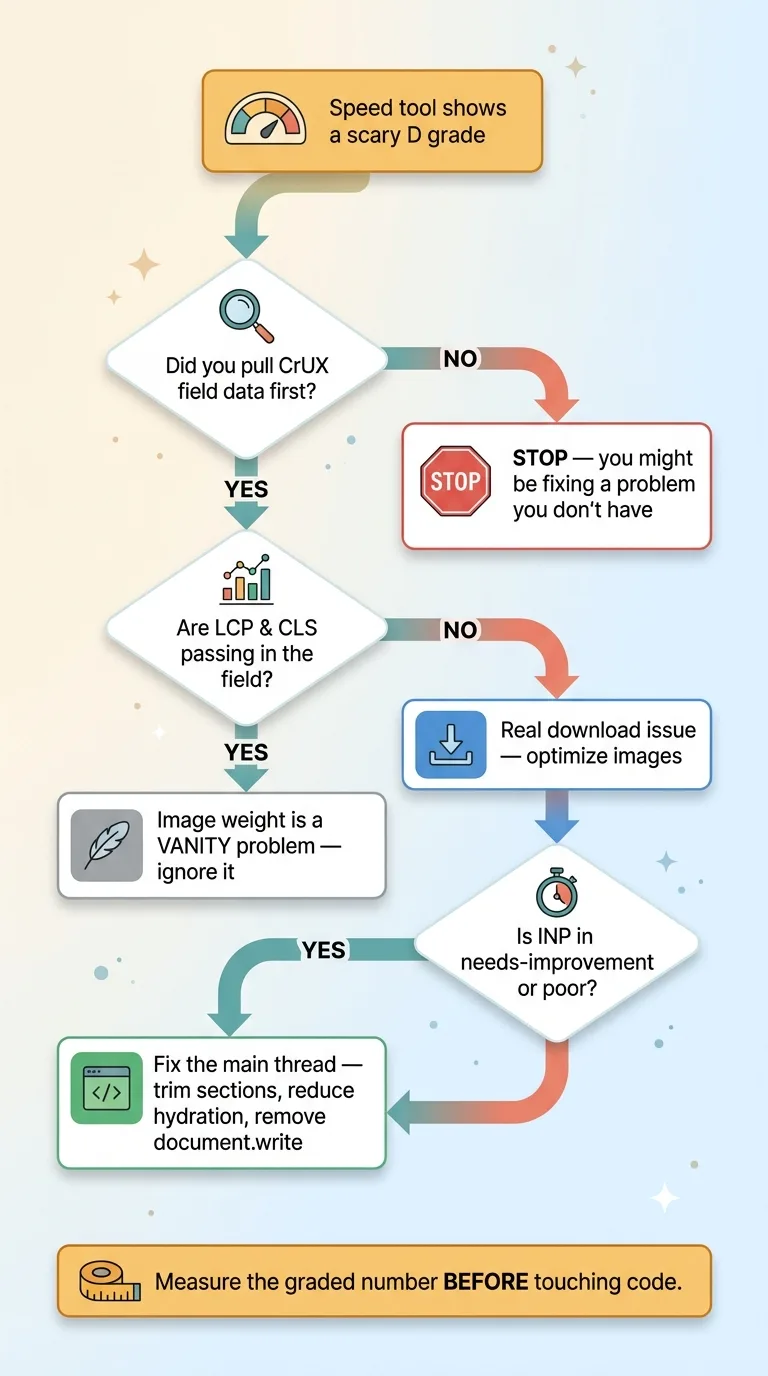 The correct optimization decision process: measure field data first
A bad speed score is not automatically costing you rankings.
Read that again if you've ever forwarded a Lighthouse report to your dev team with "we need to fix this." Lab tools optimize for a number that isn't the ranking signal. They run a synthetic throttled test designed to surface worst-case behavior, then hand you a scary letter grade. That grade can be a D while your real customers are getting a green experience.
Pull your CrUX field data first. If your LCP and CLS already pass in the field, your image weight is a vanity problem. Real, measurable, fixable, and completely irrelevant to your search rankings.
The expensive mistake here isn't slow images. It's spending a day, a week, a sprint, on the wrong metric because a tool gave you a frightening grade and the obvious fix felt productive. Most teams never check field data at all. They optimize against the lab number forever and wonder why rankings don't move.
This is the pattern I see across businesses of every size: real money spent fixing problems nobody actually had. The work looks legitimate. The reports look better. The customer experience doesn't change because the problem was never there.
Knowing which number matters before anyone touches code is the judgment call I get paid to make. It's the difference between measuring the thing that's actually graded and shipping clean work against the wrong target. I almost made this mistake on my own brand. Most teams make it and never find out.
If you suspect your team might be polishing the wrong number somewhere, that's a conversation worth having.
Want to explore what AI could do for your business?
Book a free 30-minute strategy call. No pitch deck, no sales team, just a real conversation about your operations and where AI actually fits.
Get AI insights for business leaders
Practical AI strategy from someone who built the systems — not just studied them. No spam, no fluff.
Hodgen.AI
Ready to automate your growth?
Book a free 30-minute strategy call with Hodgen.AI.
Book a Strategy Call