Measuring AI ROI: An Honest Hours-Saved Ticker
Most AI ROI claims are made up. Here's how I built a telemetry-grounded system for measuring AI ROI across 30+ projects, with honest caveats.
By Mike Hodgen
Why Almost Every AI ROI Number You've Heard Is Garbage
Every AI vendor has a number. 10x productivity. 40% time savings. 3x faster shipping. You've seen the slides. You've probably been pitched at least one of these in the last quarter.
Here's the problem with measuring AI ROI the way most vendors do it: almost nobody shows you the methodology. The number comes from a marketing deck, not from telemetry. It's a conclusion with no working shown.
The vendor math problem
Ask a vendor how they got to "40% time savings" and you'll usually get one of two answers. Either a survey where employees self-reported how much faster they felt, or a single cherry-picked workflow extrapolated across the whole company. Neither survives contact with a skeptical CFO.
A number you can't reconstruct from raw data isn't a number. It's a wish wearing a percent sign.
Vibes are not a metric
I'll be honest: I distrusted my own claims too. I'd tell people my product pipeline went from 3-4 hours to 20 minutes per item, and that's true, I timed it. But when I started saying things like "AI saves me thousands of hours a year," I caught myself repeating a feeling, not a measurement.
So I built something. An internal hours-saved ticker that pulls from actual work product across 30-plus of my own repositories. No client data, no surveys, no vibes. Just telemetry I can't fake and a multiplier I deliberately tuned to make myself look worse than I probably am.
This is how I measure AI ROI for myself now, and it's the approach I'd set up for any business serious about knowing what AI actually delivered. The rest of this piece walks through exactly how it works, including the parts where it breaks down.
Start With Telemetry You Can't Fake
The first rule of honest measurement: measure the work product, not the self-report. The moment you ask an AI (or a person) "how much time did you save," you've corrupted the data. People round up. AI models are eager to please. You need signals that exist whether or not anyone is watching.
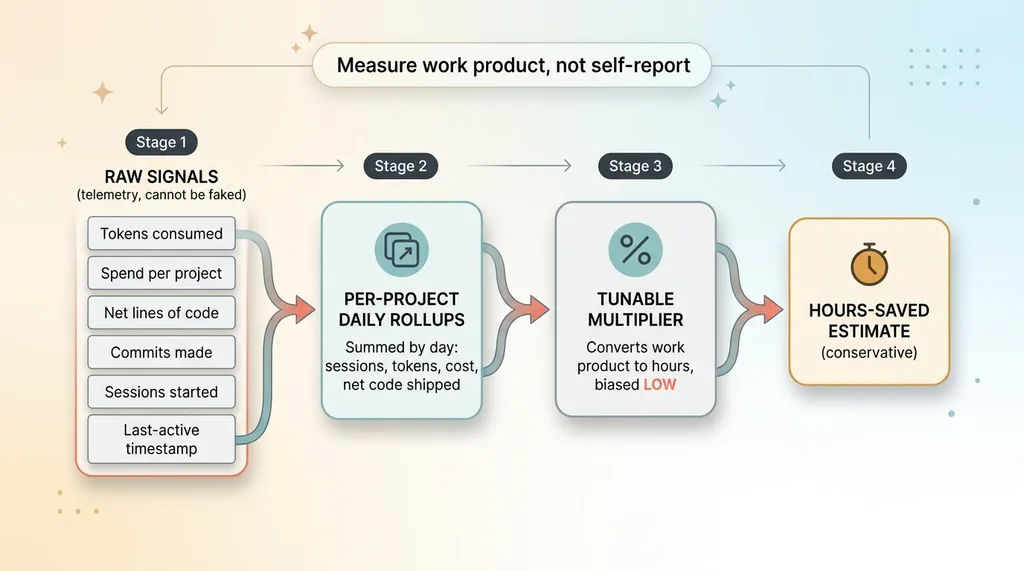 The Telemetry Pipeline: Raw Signals to Hours-Saved Estimate
The raw signals: tokens, commits, net lines, spend
In my system, every session emits a set of raw deltas: live agents running, sessions started, tokens consumed, spend per project, net lines of code written, commits made, and a last-active timestamp. These are byproducts of work happening. Nothing here is a number the AI generates about its own performance.
That distinction is everything. A commit exists because code changed. Token spend exists because compute was used. These aren't claims. They're residue.
I pull this from the same observability layer I described in a live dashboard of every AI agent working for me. That dashboard is the raw feed. The ROI ticker sits on top of it.
Per-project rollups summed by day
The raw deltas get summed by day into per-project rollups. So for any given project on any given day, I know how many sessions ran, how many tokens burned, what it cost, and how much net code actually shipped.
 Net Lines vs Gross Lines (Why Churn Should Not Count)
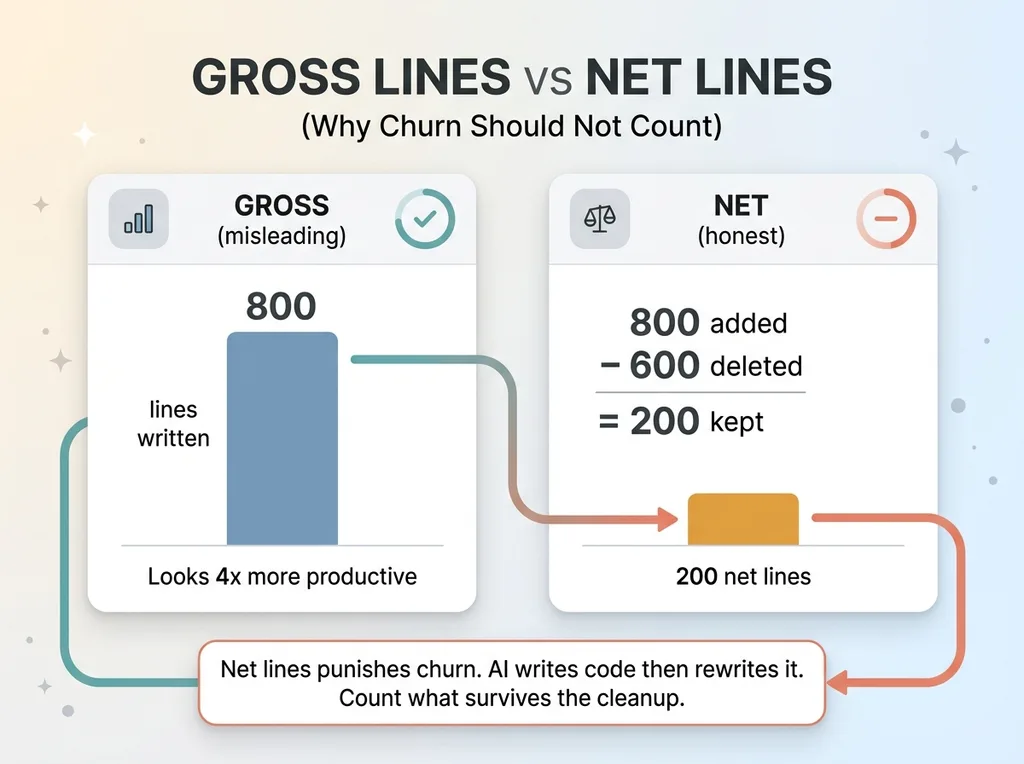
One detail matters more than people expect: I track net lines of code, additions minus deletions, not gross lines. AI loves to write code and then rewrite it. If you count gross lines, an agent that wrote 800 lines, deleted 600, and kept 200 looks four times more productive than it was.
Net lines punishes churn. That's the point. I want the number that survives the cleanup, not the number that flatters the first draft. Honest AI productivity metrics start with refusing to count work that got thrown away.
The Hours-Saved Multiplier (And Why I Made It Tunable)
Here's the hard truth at the center of all this: you cannot directly measure hours saved by AI. There is no sensor for "the time I would have spent if AI didn't exist." That counterfactual never happened.
So you estimate it from a proxy. And the entire credibility of your number lives or dies in how you build that estimate.
Converting work product into time
I built a tunable multiplier that converts work product into an hours-saved estimate. Roughly: a meaningful commit represents some chunk of manual work that didn't happen. Net lines and session counts feed into the same conversion.
For example, say 10 commits of substantive change in a project equals roughly 6 hours of equivalent manual work. The exact ratio doesn't matter as much as one decision I made and stuck to.
Tune it down, not up
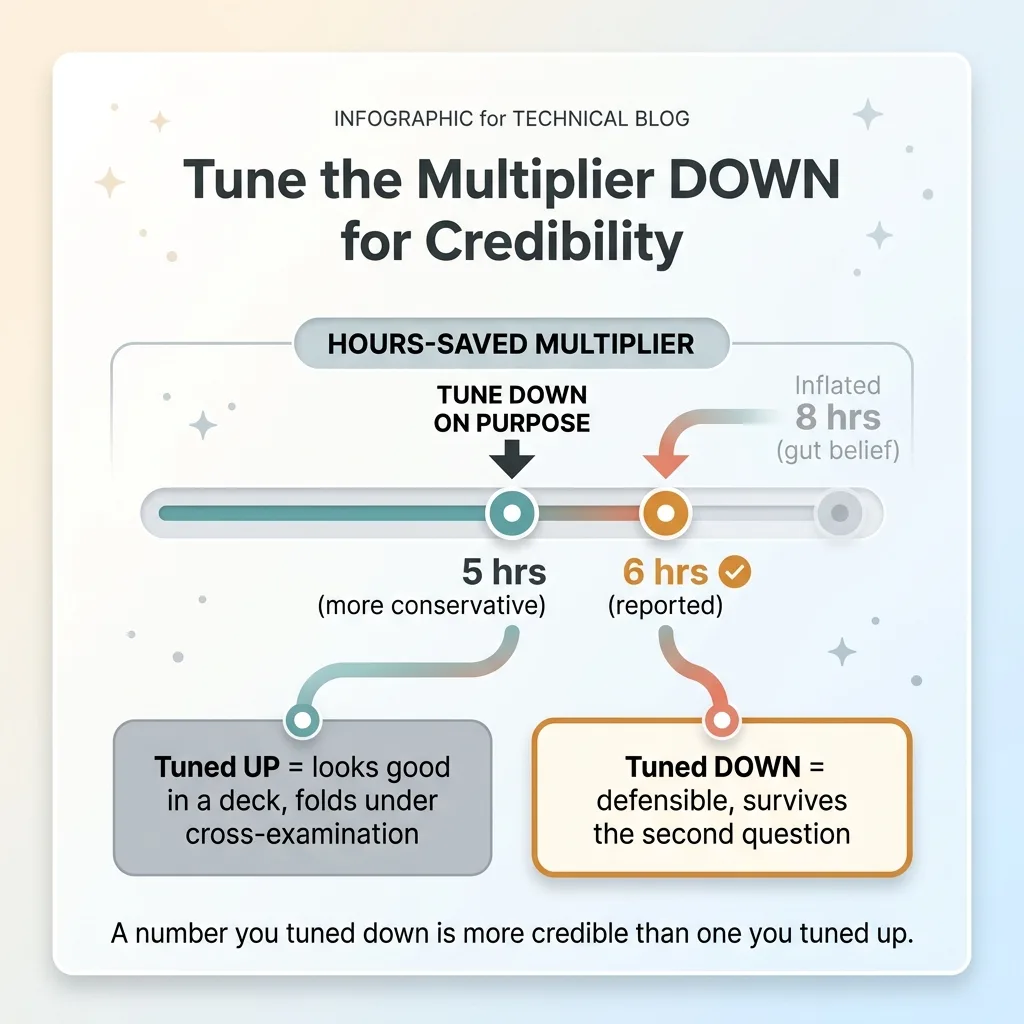
I set that conversion below what I actually believe.
 Tune the Multiplier DOWN for Credibility
If my honest gut says 10 commits equals 8 hours of manual work, I tune the multiplier so it reports 6. Maybe 5. The whole system is biased toward underestimating, on purpose.
This feels backwards if your goal is bragging. It's exactly right if your goal is a defensible number. A figure you tuned down is far more credible than one you tuned up, because the obvious failure mode of every AI ROI claim is inflation. When I tell someone my system saved 3,000-plus hours last year, I want to be able to add: "and that's the conservative estimate, here's the multiplier, push it harder if you want a bigger number."
The temptation to inflate is constant. A bigger number looks better in a deck, sounds better on a call, feels better in your own head. Resisting that temptation is the entire value of the exercise. Anyone can produce a flattering estimate. Producing one you'd defend under cross-examination is the actual work.
Graph It Over Time, With a Date-Range Selector
A single hours-saved number is a snapshot, and snapshots lie. They tell you a total without telling you whether things are getting better, worse, or quietly falling apart.
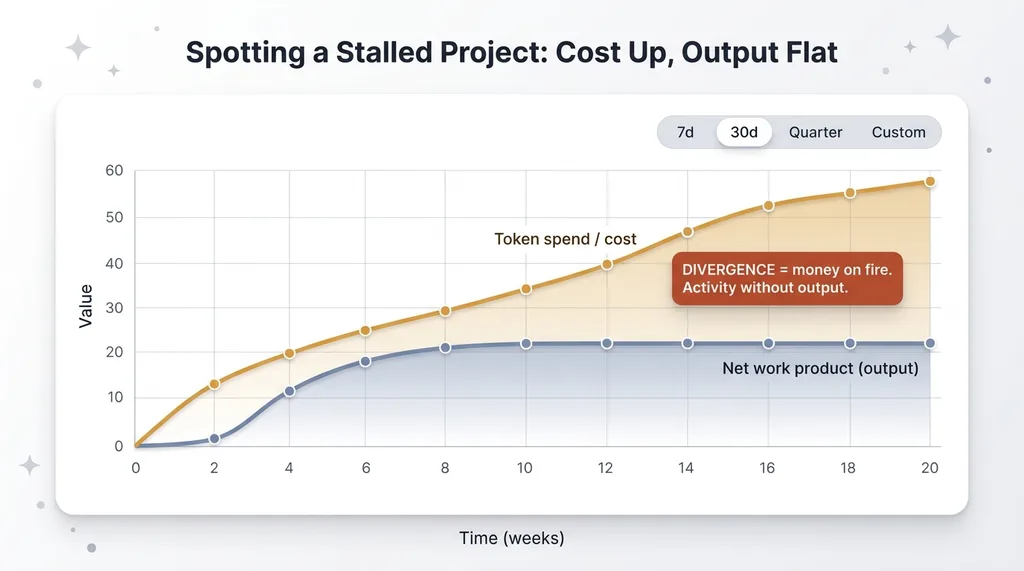
So I plot the estimate over time, with a date-range selector. Last 7 days, last 30, last quarter, custom range. The shape of the line tells you more than any single total.
Trends beat snapshots
The trend line shows which projects accelerated, which stalled, and when spend spiked without matching output. That last one is the signal I care about most.
If token spend climbs week over week while net output stays flat, that's not productivity. That's money on fire. The graph turns an abstract worry into a visible divergence: cost line going up, output line going sideways.
Spotting projects that stalled
I've caught myself this way more than once. A project shows heavy agent activity, lots of sessions, healthy token consumption, and a net-lines line that's gone flat for two weeks. Busy, but producing nothing real.
 Spotting a Stalled Project: Cost Up, Output Flat
That pattern is exactly the trap I wrote about in autonomous systems lie about success. An agent will happily report progress while spinning in circles. Activity is not output. The time dimension is how you tell the difference, because a stalled project still generates plenty of activity. It just stops generating net work product.
The graph is a bullshit detector pointed at yourself. That's the most useful thing it does.
The Caveats I Refuse to Hide
If I only told you what this measures well, I'd be doing exactly what I'm criticizing. So here's where it falls short, because the limits are as important as the capabilities.
What this measures and what it doesn't
This system measures coding-adjacent work product well. Code that shipped, sessions that ran, spend that occurred. For software-heavy work, that's a strong proxy.
It measures almost nothing about strategy, judgment, or the decision of what to build. It can't see quality. It doesn't know if the code is good, maintainable, or about to cause an outage. Net lines of code is a proxy, not truth.
Where the estimate breaks down
A weekend spent rebuilding something badly will inflate the number beautifully. Lots of commits, lots of net lines, a glowing hours-saved figure, all of it representing work that made the product worse.
That's the failure mode I want you to sit with. A hundred saved hours building the wrong thing is a loss, not a win. The ticker can't tell the difference. It measures effort converted to output, not whether the output was worth having.
This is precisely why measurement and strategy are different problems. The number tells you how much got done. It says nothing about whether it was the right work. For that qualitative side, I keep a deliverables log that proves value, which captures what actually shipped and whether it mattered.
The ticker is one input to ROI. Not the whole story. Anyone who tells you a single number captures AI's value is selling you the same wish I started this article complaining about.
How to Instrument This in Your Own Business
You don't need 30 repos and 22,000 lines of Python to apply this. The principle generalizes to any business: measure AI ROI from actual output, not from claims.
Pick proxies tied to real deliverables
The proxy changes by function, but the logic doesn't.
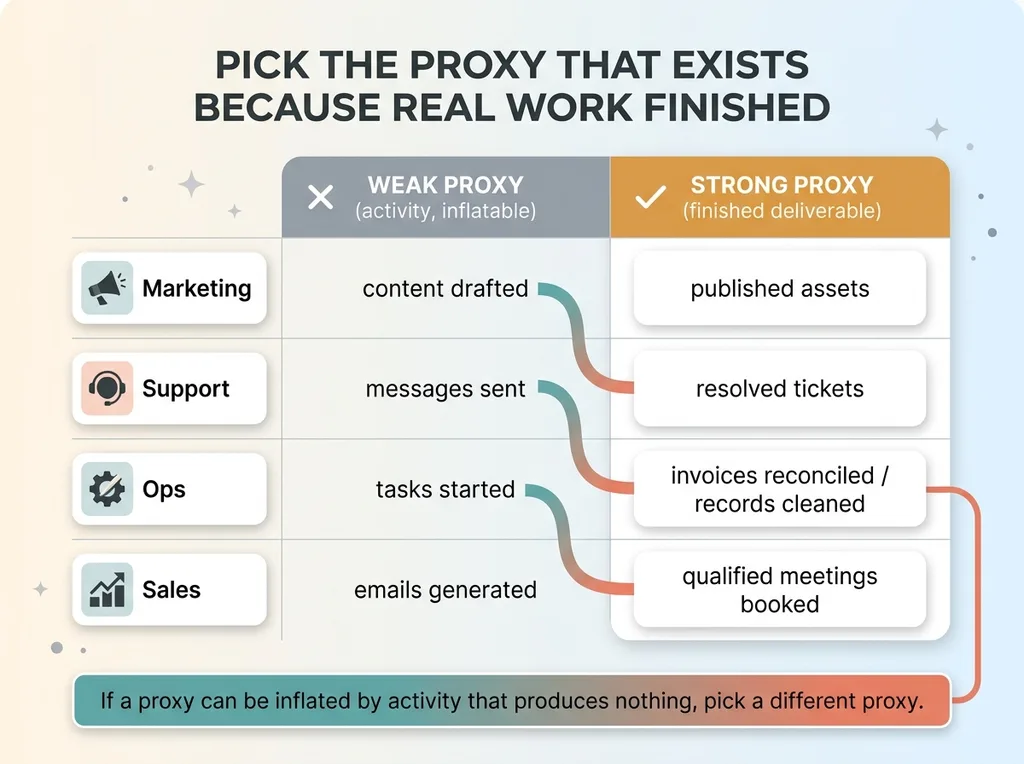 Choosing Honest Proxies by Business Function
- Marketing: published assets, not "content drafted." A draft nobody shipped saved zero hours.
- Support: resolved tickets, not messages sent. Resolution is the deliverable.
- Ops: documents processed, invoices reconciled, records cleaned. The completed unit of work.
- Sales: qualified meetings booked, not emails generated.
In every case you're picking the thing that exists because real work finished, the same way a commit exists because code changed. If your proxy can be inflated by activity that produces nothing, pick a different proxy.
Bias every assumption toward conservative
Three rules carry the whole approach:
- Instrument the work product, not the activity. Activity is easy to fake and easy to fool yourself with. Finished deliverables aren't.
- Make every conversion assumption tunable and biased low. Decide how much manual time each deliverable represents, then knock it down. You want a number you'd defend, not one you'd hope nobody questions.
- Graph it over time so you catch drift. Rising cost with flat output is the universal warning sign, and you only see it on a trend line.
I won't pretend this is free. Instrumenting real telemetry takes upfront work, and most people skip it precisely because vague numbers are easier to brag about. A made-up "40% faster" costs nothing and impresses the room. An honest, conservatively-tuned figure is less impressive and far more useful, because it survives the second question.
An Honest Number Is Worth More Than a Big One
When your board asks what AI actually delivered, or your CFO wants to know if the spend was worth it, a defensible number lands harder than any vendor's 10x claim. Not despite being smaller. Because you can show the math.
"Here's the telemetry, here's the multiplier, here's why I tuned it conservative, and here's the trend over the last two quarters." That holds up under scrutiny. The 10x claim folds the moment anyone asks how it was calculated.
This rigor is what separates real AI deployment from AI theater. Theater produces a slide. Deployment produces a number you can reconstruct from raw data at any time.
It's how I run my own portfolio of 30-plus projects, and it's how I'd set up measurement for any business I work with. The goal is simple: you should never have to trust a number you can't rebuild yourself. If you want that kind of honesty in how your AI work gets measured, that's exactly the standard I bring this kind of rigor to your AI work.
Want to explore what AI could do for your business?
Book a free 30-minute strategy call. No pitch deck, no sales team, just a real conversation about your operations and where AI actually fits.
Get AI insights for business leaders
Practical AI strategy from someone who built the systems — not just studied them. No spam, no fluff.
Hodgen.AI
Ready to automate your growth?
Book a free 30-minute strategy call with Hodgen.AI.
Book a Strategy Call