The OpenTelemetry Gotcha That Multiplies Your Metrics
OpenTelemetry cumulative counters double-count when you sum them on ingest. Here's the GREATEST-not-SUM fix that saved me a confusing afternoon.
By Mike Hodgen
The number that was four times too big
I was staring at a dashboard I'd built to watch my own AI agents work. Token usage per session. Lines of code written. The kind of telemetry you want when you've got a fleet of agents running tasks and you need to know what each one actually costs you. (I wrote about the broader build here: a live dashboard of every AI agent working for me.)
The numbers were wrong. Not obviously wrong. That would have been easy.
They were wrong in the worst possible way: plausible. A single session showed roughly 120,000 tokens. That's a lot, but not crazy for a long agent run. Except I knew that particular session couldn't have used more than about 30,000. The real number was hiding under something that had multiplied it by roughly four.
No error. No crash. No red text anywhere. Just a clean dashboard rendering a confident lie.
This is the dangerous category of bug. A missing metric tells you nothing, and you know you have nothing. A wrong metric tells you something false, and you act on it. If I'd taken those inflated numbers to a decision about which agents to keep, which to kill, what my token spend really looked like, every conclusion would have been built on sand.
The culprit was opentelemetry cumulative counters, and the way I was ingesting them. It's a trap that catches a lot of people wiring OTEL for the first time, because the data arrives looking like one thing when it's actually another.
Here's exactly what went wrong, and the two-line fix that corrected it.
Why OpenTelemetry counters are cumulative, not deltas
What the OTLP spec actually sends
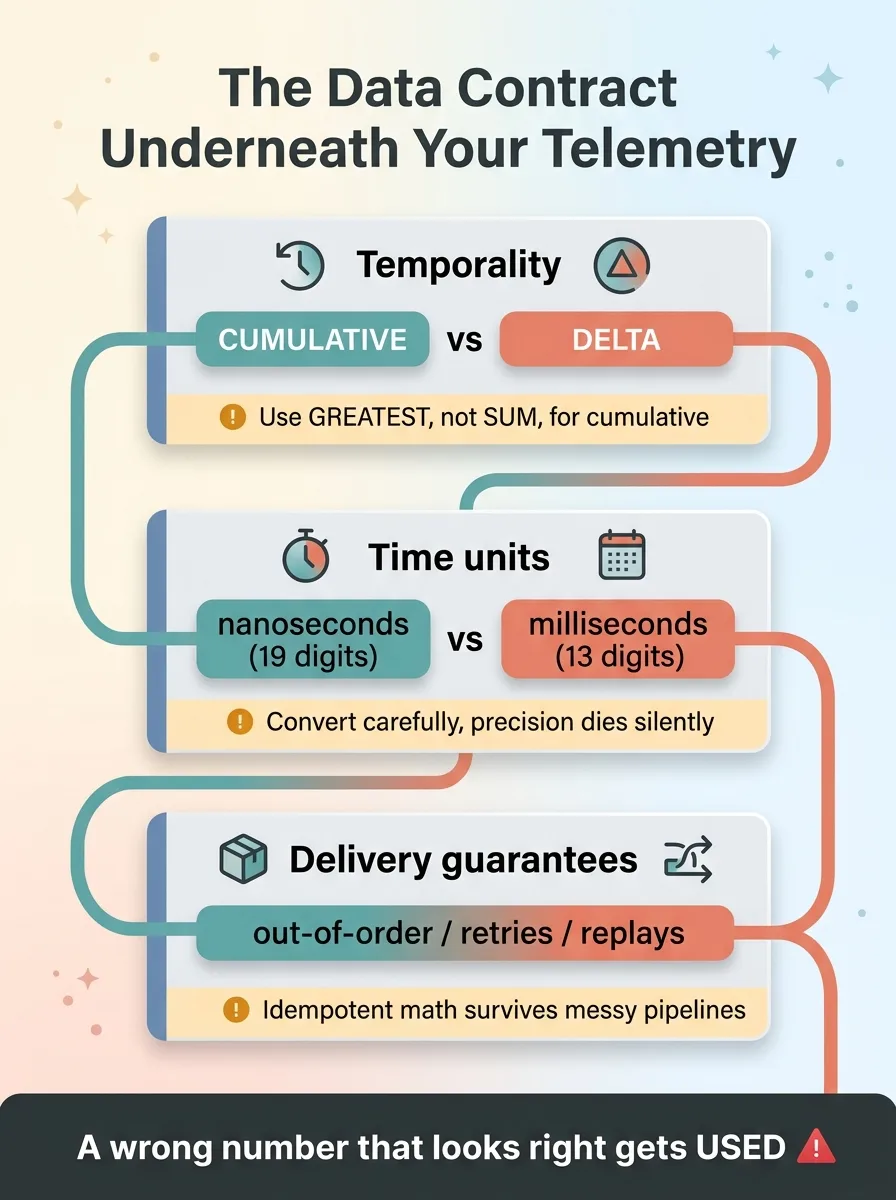
An OpenTelemetry counter is represented as a Sum data point, and that Sum has an aggregation temporality. There are two options in the spec: DELTA and CUMULATIVE. Most SDKs default to CUMULATIVE for counters, and that default is the whole story.
A cumulative counter reports a running total since the process started, not the change since the last export.
So picture an agent that exports its metrics every 5 seconds. The session runs for 60 seconds. That's 12 export records sent over the life of the run. Each record carries the total token count as of that moment, climbing toward the final number.
The 12th record already contains the full count. The first 11 are just earlier snapshots of the same running total on its way up.
The mental model most people get wrong
The trap is that otel metrics ingestion delivers these as a stream of separate records. They land in your collector one after another, each with its own timestamp, each looking like a discrete event you should account for.
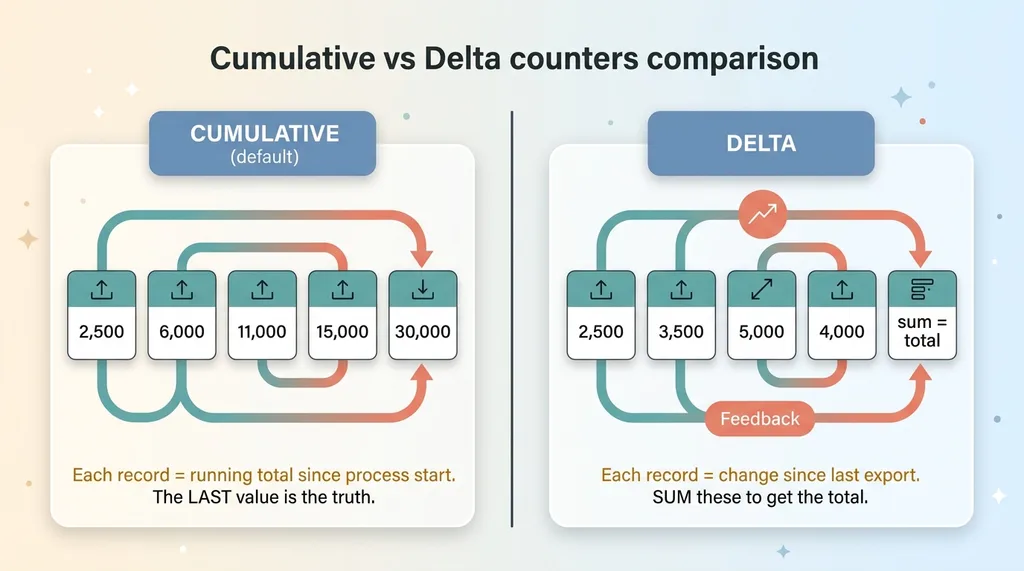 Cumulative vs Delta counters comparison
So the instinct, especially if you've done any event-stream work, is to sum them as they arrive. Add each new value to the last. Build up the total.
That's exactly backwards for a cumulative counter. The total is already in there. By summing, you're adding 12 partial views of one number together as if they were 12 different numbers.
A delta counter would behave the way the summing instinct expects: each export reports only what changed since the last one, and you'd sum those deltas to reconstruct the total. But that's not what most agents send by default, and it wasn't what mine sent. Knowing which temporality you're actually receiving is the entire game. Get that wrong and the plumbing lies to you.
How summing on ingest multiplies your metrics
Let me walk the math, because it's the clearest way to see the damage.
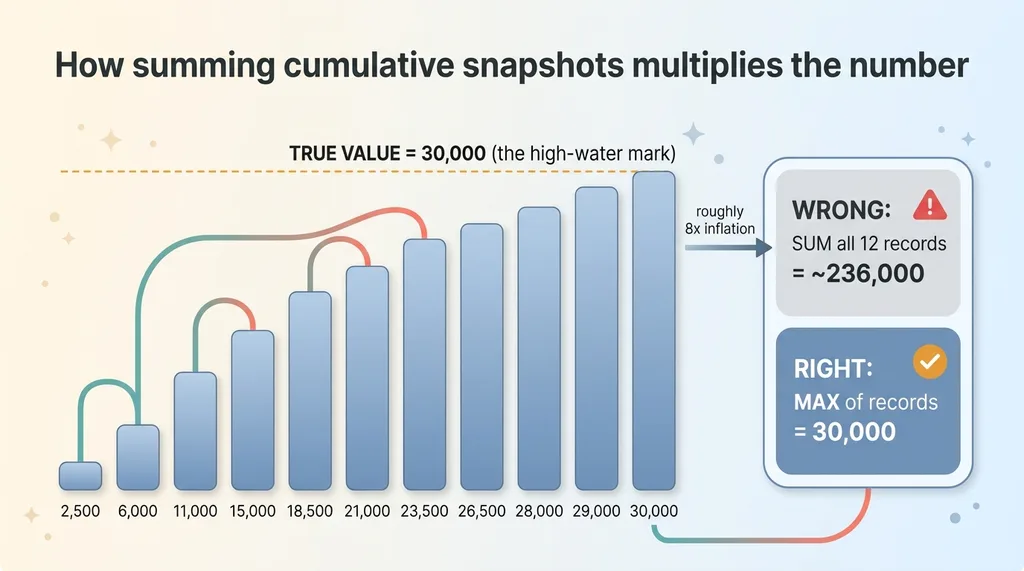 How summing cumulative snapshots multiplies the number
Say a session genuinely used 30,000 tokens. Over its 60-second run, exporting every 5 seconds, it produced 12 records. Those records climb something like this:
2,500, then 6,000, then 11,000, then 15,000, then 18,500, then 21,000, then 23,500, then 25,000, then 26,500, then 28,000, then 29,000, then 30,000.
The last value, 30,000, is the truth. That's the running total at the end of the session.
Now sum all 12 rows. You get roughly 236,000. Almost eight times the real number in this example, and in my actual data it landed closer to 4x because my export cadence and session lengths were different. Either way the principle holds.
Here's the kind of query that causes it, with no real tables involved:
-- WRONG: treats cumulative snapshots as separate events
SELECT session_id, SUM(token_count) AS total_tokens
FROM metric_records
GROUP BY session_id;
That looks completely reasonable. It's also wildly wrong for a cumulative counter.
The inflation factor is roughly tied to how many times the agent reported during the run. Longer sessions exported more often, so they inflated more. Chatty agents that emitted frequently looked worse than quiet ones. The bug wasn't even uniform, which made it harder to spot, because the most active agents (the ones I cared about most) had the most distorted numbers.
This is telemetry double counting in its purest form. Not duplicate events. The same total, counted over and over, every time it was reported.
The fix: GREATEST instead of SUM
Why max is correct for cumulative counters
A cumulative counter only ever climbs. It never goes down within a session. That single property tells you everything you need: the true value for a session is the maximum observed value, not the sum.
The 12th record held 30,000. So did the truth. The right answer was sitting in the data the whole time. I just needed to take the high-water mark instead of adding the snapshots together.
Upserting derived session state
The clean way to do this is to maintain a derived session-state row and upsert into it on every export. On conflict, you raise the stored value to the latest maximum rather than adding to it.
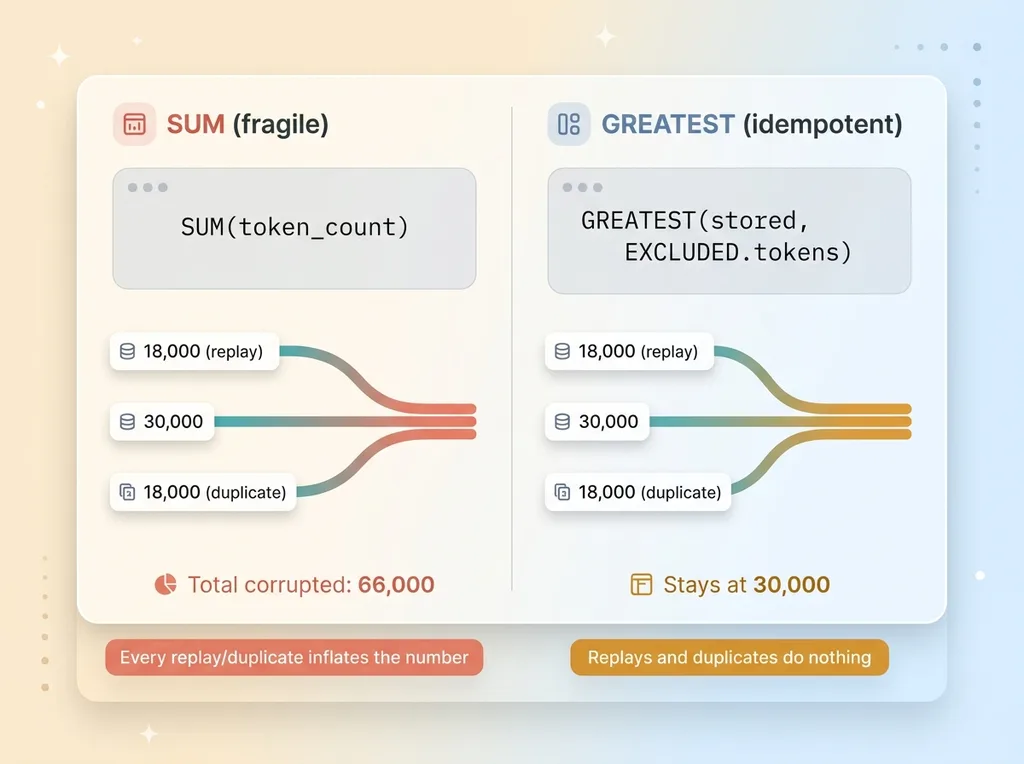 SUM vs GREATEST ingest query and idempotency
In otlp postgres terms, that's an INSERT with ON CONFLICT DO UPDATE, using GREATEST to keep the running high:
-- RIGHT: keep the high-water mark per session
INSERT INTO session_totals (session_id, tokens)
VALUES ($1, $2)
ON CONFLICT (session_id)
DO UPDATE SET tokens = GREATEST(session_totals.tokens, EXCLUDED.tokens);
Every incoming export only ever raises the stored total to the latest observed value. The 2,500 record sets it to 2,500. The 30,000 record raises it to 30,000. The eleven records in between never push it past where it already is.
The part I like most: this is idempotent. Telemetry pipelines deliver out of order. They retry. They replay. With SUM, every duplicate or replay corrupts your number a little more. With GREATEST, none of that matters. A replayed 18,000 record can't push a session that already hit 30,000 backward or forward. The worst a duplicate can do is nothing.
That's the difference between a query that's correct on a good day and one that's correct on every day, including the messy ones a real pipeline actually throws at you.
The second gotcha: nanosecond timestamps and BigInt
There was a second trap waiting in the same pipeline, and this one was about time.
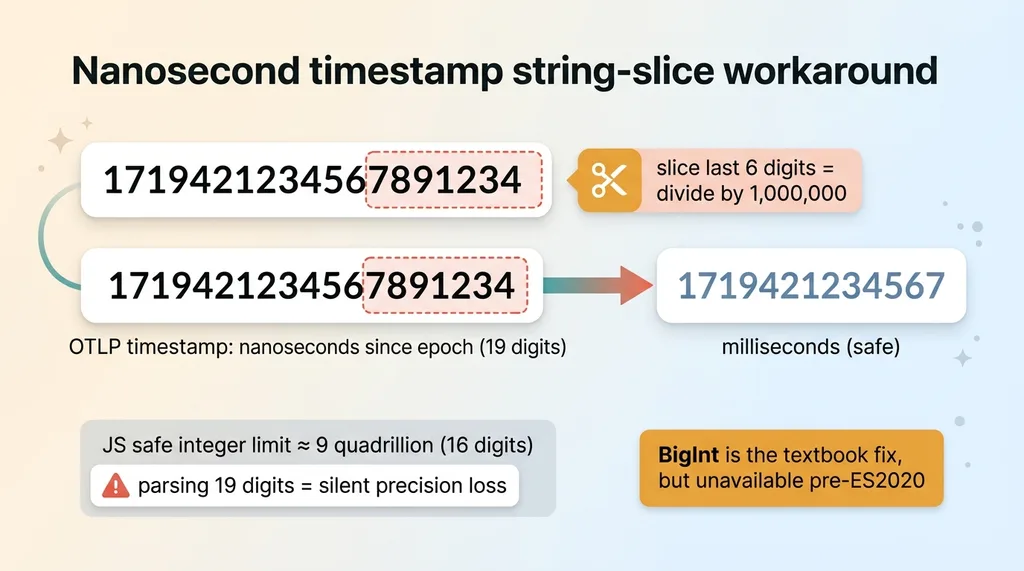 Nanosecond timestamp string-slice workaround
OTLP timestamps arrive as nanoseconds since the Unix epoch. That's a number with 19 digits. JavaScript's safe integer range tops out around 9 quadrillion, which is 16 digits. Nanosecond timestamps blow straight past it.
The moment you parse one as a regular number, you lose precision silently. The correct way is BigInt, which handles arbitrary-size integers without rounding.
Except my build target was pre-ES2020. BigInt either isn't available there or breaks the toolchain depending on how you've got things configured. I couldn't just reach for the textbook answer.
So I did something inelegant that actually worked. I converted nanoseconds to milliseconds by treating the timestamp as a string and slicing the last six digits off before parsing. Nanoseconds to milliseconds is a division by one million, which is exactly six zeros, which is exactly six characters off the end of the numeric string.
// nanoseconds (string) -> milliseconds, no BigInt required
const ms = Number(nanoString.slice(0, -6));
No BigInt math. No precision loss in the range I cared about. It ships on the target.
I'll be honest: this is a workaround driven by a constraint, not how you'd do it on a modern runtime. If I'd had ES2020, I'd have used BigInt and moved on. But the constraint was real, the deadline was real, and string-slicing the timestamp was correct and shippable. Sometimes the right engineering decision is the one that works inside the box you're actually in, not the one that's prettiest in a blog post.
Why this kind of bug is so dangerous
Step back from the SQL for a second, because the lesson matters more than the fix.
 OTEL pipeline data contract checklist
This bug never threw an error. It never crashed. Nothing logged a warning. It produced numbers that were wrong but believable, sitting on a dashboard that looked finished and trustworthy.
That's the worst category of failure: silent, plausible, and decision-shaping. A crash gets fixed because it screams. A wrong number that looks right gets used.
If I'd reported my token spend off those inflated counts, I'd have thought my agent fleet was four times more expensive than it was. If I'd ranked agents by productivity, the chattiest ones would have looked the most productive purely because they exported more often. Every downstream conclusion would have been garbage, and I'd have had no reason to doubt any of it.
I've been on the other side of this too, where a pipeline went the opposite direction and a dashboard showed zeros for two weeks while everyone assumed it was just a quiet stretch. Zeros and inflated numbers are siblings. Both are the tooling lying to you with a straight face.
The discipline that catches this isn't more AI. It's understanding the data contract underneath your tooling. Cumulative versus delta. Nanoseconds versus milliseconds. What the spec actually promises versus what the data looks like when it lands. None of that is glamorous, and all of it determines whether your numbers mean anything.
What this says about who you let near your plumbing
Anyone can prompt an LLM to scaffold an OTEL pipeline. You'll get a collector, an exporter, an ingest endpoint, a table, and a dashboard. It'll run. It'll show numbers.
Whether those numbers are correct is a different question entirely, and it's not one the demo answers.
Knowing that opentelemetry cumulative counters need GREATEST and not SUM, that nanosecond timestamps will quietly destroy your math or break your build target, that idempotency is what keeps a replayed export from corrupting your totals: that's the gap between something that looks like infrastructure and something you can actually trust to drive a decision.
That's the work I do. I build the systems, and I understand the layer underneath them. When numbers drive decisions, I want deterministic code owning the math, not a vibe. (I wrote more on that principle here: let the code do the math.)
If your team is wiring telemetry, AI agents, or any pipeline where the output shapes what you do next, you want someone who reads the spec instead of guessing at it. The cost of guessing isn't a crash. It's two weeks of confident decisions built on a number that was four times too big.
If that sounds like your stack, bring me in to look at your stack before the wrong numbers go to a board meeting.
Ready to bring AI leadership into your company?
I work with a small number of companies at a time. If you're serious about AI, apply to work together and I'll review your application personally.
Get AI insights for business leaders
Practical AI strategy from someone who built the systems — not just studied them. No spam, no fluff.
Hodgen.AI
Ready to automate your growth?
Book a free 30-minute strategy call with Hodgen.AI.
Book a Strategy Call