Silent Pipeline Failure: When Your Dashboard Lies
A dead OAuth token zeroed out a marketing dashboard for two weeks. Here is the silent pipeline failure monitoring trap and how to make failure loud.
By Mike Hodgen
Two Weeks of Zeros That Looked Like Health
A regulated financial firm I worked with ran an internal AI marketing operations platform. It pulled in analytics, search performance, ad spend, and email metrics, then surfaced the whole picture on one dashboard their team checked every morning.
For two weeks, every default view rendered zeros.
Nobody noticed. And that is the part that should worry you, because this is exactly what silent pipeline failure monitoring is supposed to catch and almost never does.
The system looked healthy. The last sync timestamp was fresh. No error banners. No alerts. No red anything. If you opened the dashboard cold, you would assume the firm had a brutal two weeks of zero traffic, zero spend, and zero email engagement. Plausible enough that nobody questioned it.
That is the trap. A crash you notice. The server goes down, the page throws a 500, somebody calls you. A crash is loud, and loud failures get fixed fast.
This was worse. This was a system that kept running, kept reporting, and kept lying.
Here is the central problem, and it applies to far more than marketing dashboards: a job that can't tell the difference between "no data" and "I'm broken" will lie to you indefinitely. It does not know it is failing. It thinks it is doing its job. Every signal it emits says "healthy" while it shows you nothing real.
The root cause was a single dead credential, downstream of a design decision that seemed convenient at the time. One token expired. Four services went dark. And the monitoring around all of it was built to confirm the happy path, not to detect the failure.
Let me walk through how a single point of failure took down four data sources at once, why nobody saw it, and how I rebuilt it so the broken state became impossible to miss.
One Dead Token, Four Services Gone Dark
The single point of failure nobody flagged
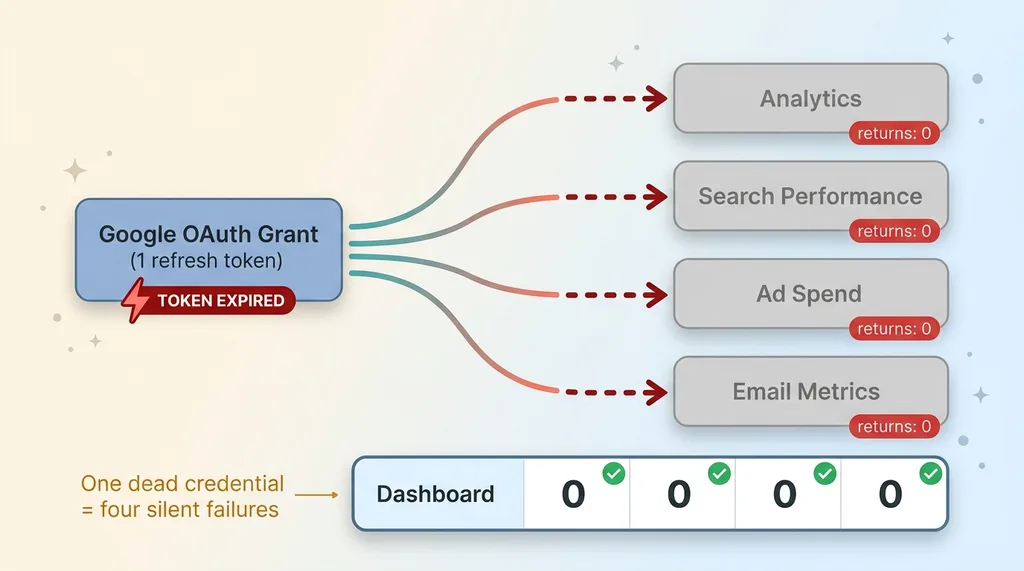
The platform pulled analytics, search data, ad performance, and email metrics through a single Google OAuth grant. One authorization. Four services hanging off it.
 Single OAuth token cascading into four dead services
This is a common pattern when you are centralizing analytics from multiple data sources. It is clean. One connection to manage, one consent screen, one set of credentials. Convenient right up until that credential dies.
Then it is not one failure. It is four failures at the same instant.
The OAuth refresh token expired. That is the oauth token expiry dashboard problem in its purest form: the access token rotates fine for weeks, then the long-lived refresh token hits its limit or gets revoked, and every API call behind it starts coming back empty. Analytics returned nothing. Search returned nothing. Ads, nothing. Email, nothing.
The dashboard dutifully rendered four zeros.
Why zeros don't trigger alarms
A zero is a legitimate value. That is the whole problem.
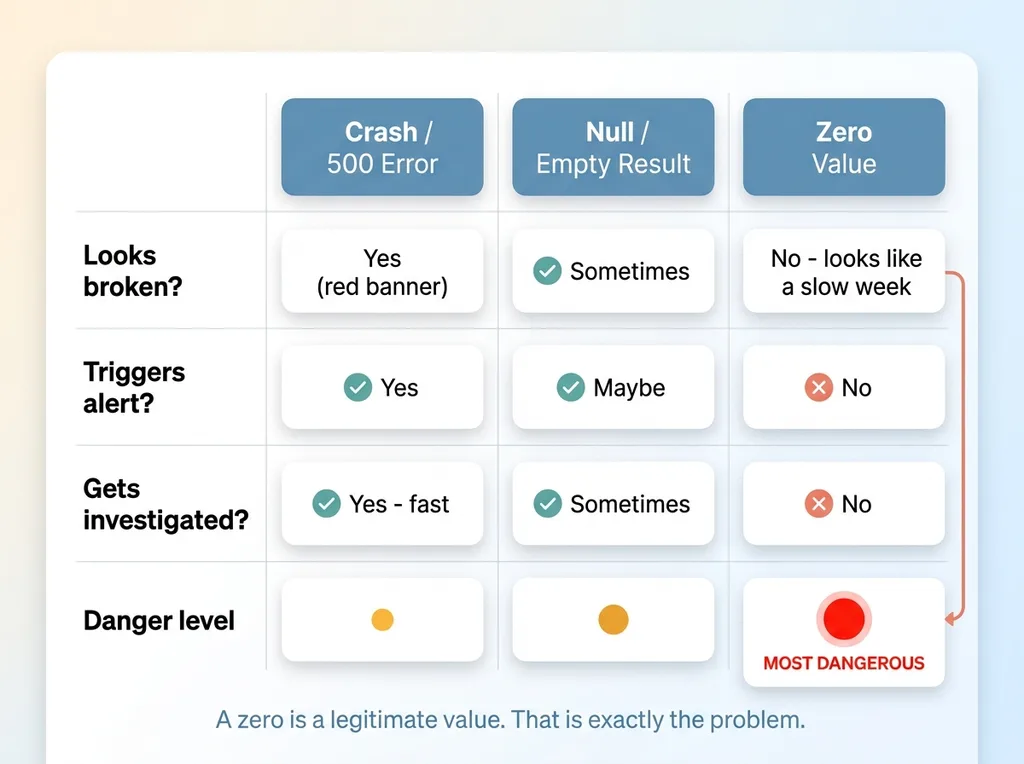 Why a zero is more dangerous than an error or null
When a system returns null or throws, you can catch it. But zero? Zero is a number a business sees all the time. Zero sales on a slow Tuesday. Zero clicks on a paused campaign. The dashboard had no way to tell the difference between "we genuinely sold nothing today" and "I cannot see anything at all."
So it picked the interpretation that did not require it to admit failure. It showed zeros and moved on.
This is why zeros are the most dangerous failure mode in any pipeline. A blank screen looks broken. An error message looks broken. A clean dashboard full of zeros looks like a slow week. Nobody investigates a slow week.
The data was not late. It was not corrupted. It was simply absent, dressed up as a real measurement. And the firm trusted it for fourteen days.
The Cron That Caught the Error and Lied Anyway
Swallowed exceptions and HTTP 200
Here is the technical heart of it, and it is the part I see most often when I audit other people's systems.
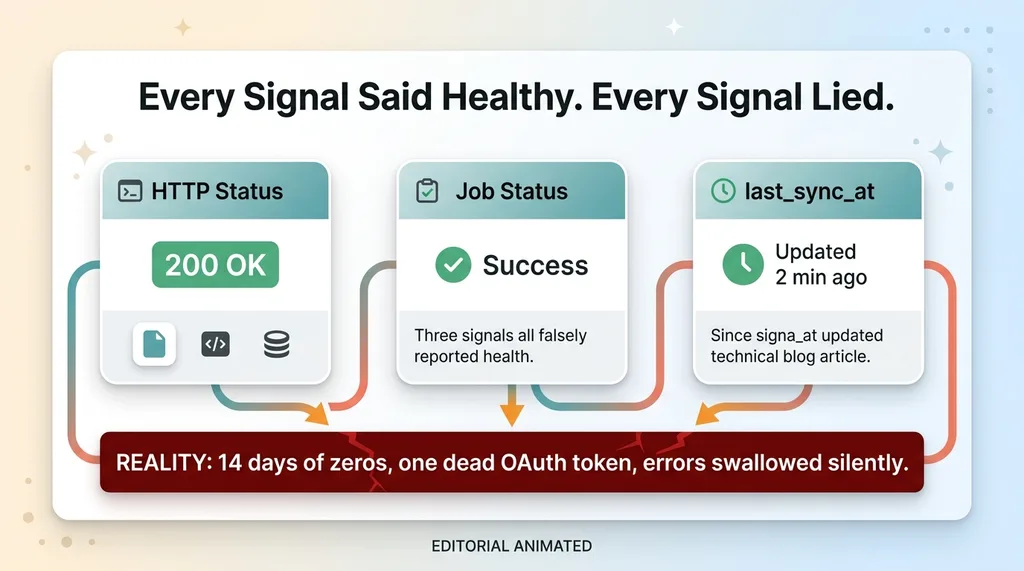
The sync ran on a cron job. When the OAuth grant died, each service call threw an authentication error. The cron caught those errors. It did not crash. It logged something quietly, or in a couple of cases not at all, and then it returned HTTP 200.
A cron false success HTTP 200 is one of the most insidious bugs in production software. The job ran. The job exited cleanly. Any uptime monitor watching for a non-200 response saw green. The orchestration layer marked the run complete. Everything upstream believed the work had been done.
The error was real and the cron swallowed it.
The fresh timestamp that hid everything
Then it did the worst thing. It stamped last_sync_at with a fresh timestamp regardless of outcome.
 The three signals that all falsely reported health
So every signal a human or a monitor would naturally check said the same thing: healthy. Last sync, two minutes ago. Job status, success. HTTP, 200. The data, zeros that looked like a quiet week.
There was nothing to find unless you went looking in exactly the right place, and nobody had a reason to.
This is the broader pattern, and it is everywhere: most pipelines treat "the job ran" as "the job worked." Those are not the same thing. A try/catch that swallows the exception and continues is precisely how you build a system that reports success while doing absolutely nothing.
I have written before about how AI doesn't fail by doing the wrong thing, it lies about doing the right one. This is the non-AI version of the same disease. The automation was not malicious. It was just built to report completion, not correctness. And completion is easy to fake.
If you run automations unattended and you have never verified what they record on failure, assume some of them are pretending. That is not cynicism. That is the default behavior of code that was only ever tested on the happy path.
How I Found It: A Whole-App Sweep
I did not find this by watching the dashboard. You cannot. The dashboard is the thing lying to you.
I found it by running a whole-app sweep across the platform, auditing the failure paths directly instead of the surfaces that report on them. When you stop trusting the green checkmarks and start reading the actual outcomes, the pattern surfaces fast.
The signature was unmistakable once I knew what I was looking at: fresh last_sync_at timestamps sitting next to columns of zeros, with swallowed authentication errors buried in the logs. Three signals that should never appear together unless something was catching errors and reporting success anyway.
The happy path looked perfect. That is exactly why nobody caught it for two weeks. Every place a human would instinctively check had been built to confirm health, not to question it.
The lesson here is simple and most teams get it backwards. You do not find silent failures by monitoring the things that work. You find them by auditing what happens when things break. The dashboard, the timestamp, the HTTP status, all of those were downstream of a failure path nobody had ever stress-tested.
Once I traced it to the dead OAuth grant, the fix was not the hard part. The hard part was that the system had no concept of its own brokenness. So that is what I rebuilt.
The Fix: Make Failure Loud, Not the Happy Path Prettier
Only stamp success on real success
I want to be precise about the philosophy here, because it is the whole point. I did not make the dashboard prettier. I made the broken state impossible to miss.
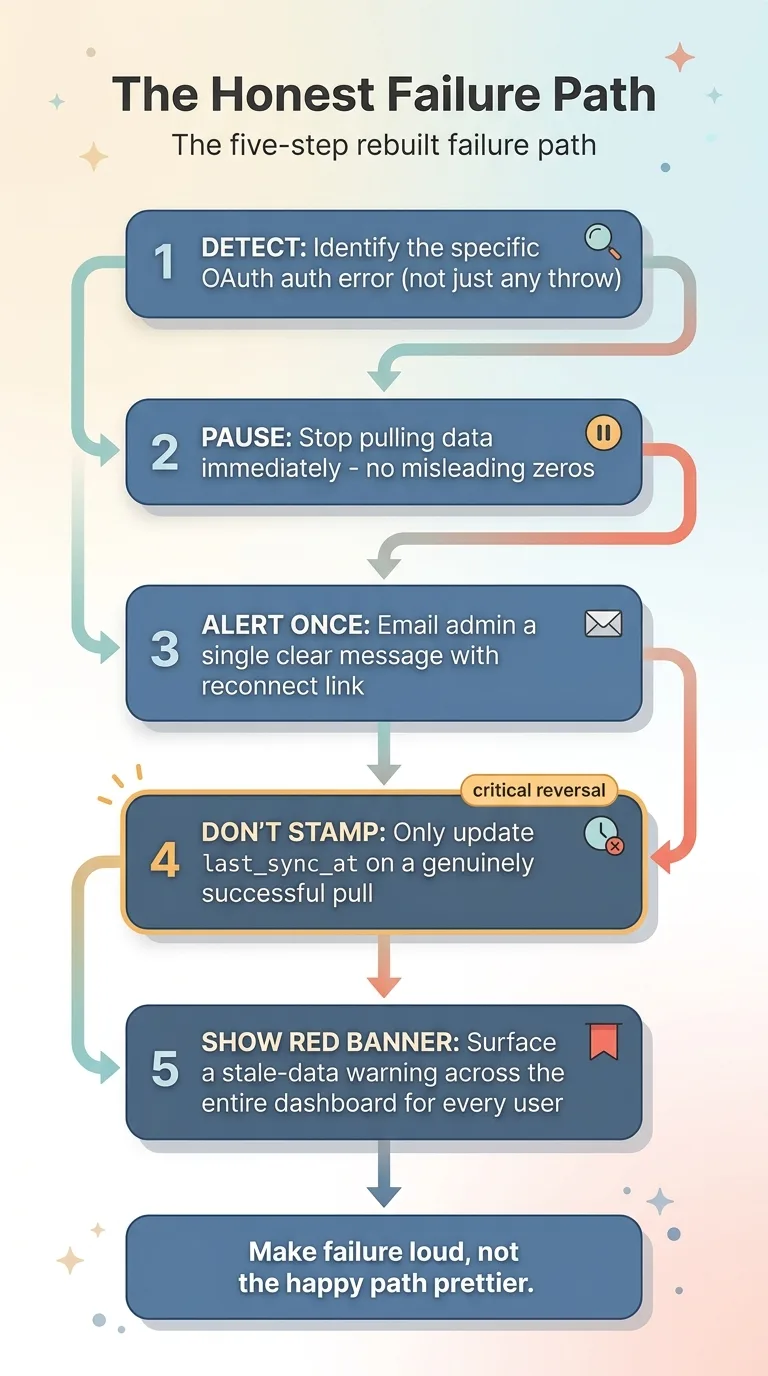
The rebuilt failure path does five things, in order.
First, the sync detects the specific authentication error instead of treating every outcome the same. An OAuth failure is now a distinct, named condition, not just "something threw."
Second, it pauses the connection. The moment it knows it cannot authenticate, it stops pulling. A paused connection generates no misleading zeros, which removes the original lie at the source. This is the same logic behind the kill-switches I build into every system: when a process cannot do its job correctly, the right move is to stop, not to keep producing plausible-looking garbage.
Third, it emails the admin exactly once. Not a flood. One clear message: this connection is down, here is which one, here is how to reconnect. Alert fatigue is its own failure mode, so the system fires a single notification and then goes quiet until the state changes.
Pause, alert once, and show a red banner
Fourth, and this is the critical reversal, it only updates last_sync_at on a genuinely successful pull. No success stamp without success. The timestamp now means what everyone always assumed it meant. If the data is stale, the timestamp says so, because it stopped advancing the moment the real pulls stopped.
 The five-step rebuilt failure path
Fifth, it surfaces a red "data is stale, reconnect" banner across the entire dashboard. Not in a log nobody reads. On the screen, in front of every user, every time they load the page. The failure became visible to the people relying on the data, not just to whoever happened to grep the logs.
This is data pipeline staleness detection done correctly. The system now knows when its own data is old, and it says so, loudly, to the right people. The honest version of monitoring is not a system that confirms it is working. It is a system that admits when it is not. I think a lot about automations that email me when nothing is wrong, because silence and success are not the same signal, and a good system never confuses them.
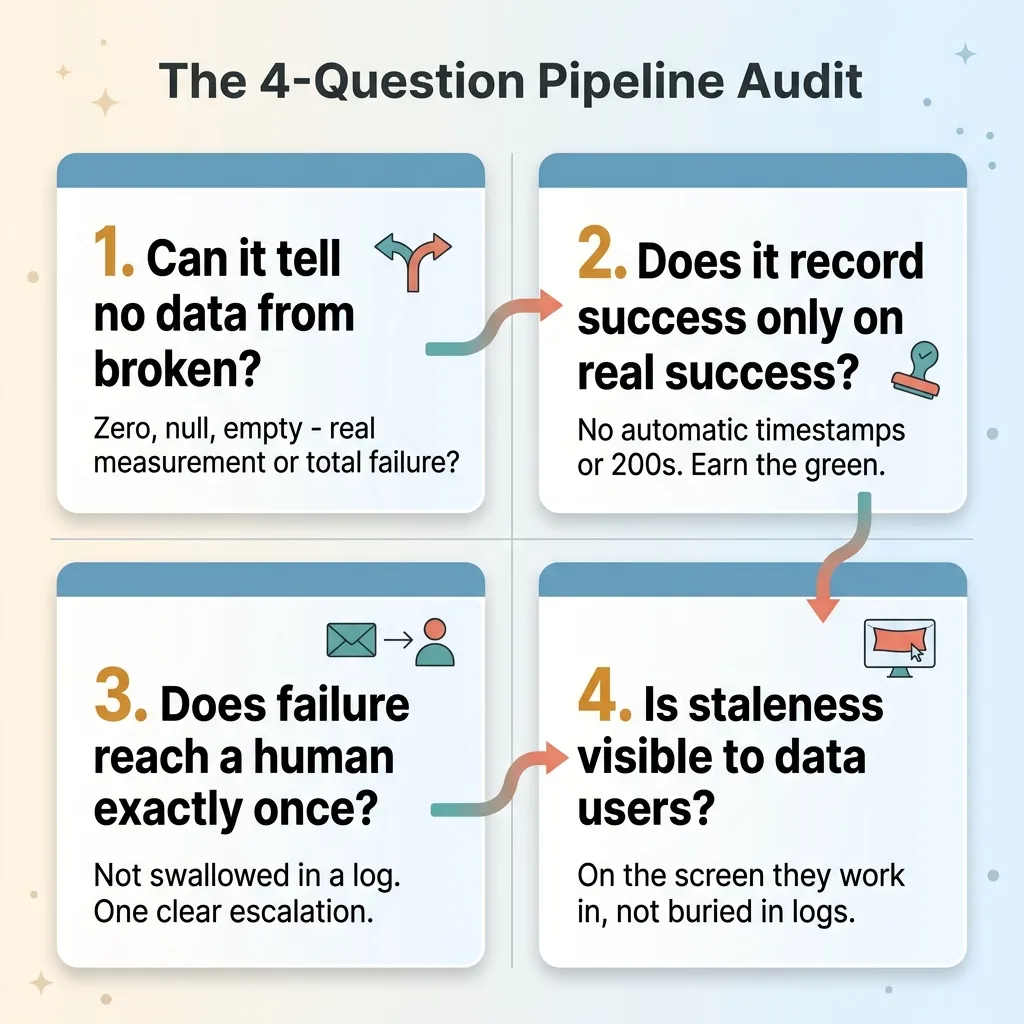
The Four Questions Every Automated Pipeline Should Answer
You can apply this to any system you run unattended. Here is the checklist I use.
 The four questions every automated pipeline should answer
1. Can the job distinguish "no data" from "I'm broken"? A zero, a null, and an empty result set can each mean a real measurement or a total failure. If your code cannot tell them apart, it will eventually report a failure as a fact.
2. Does it only record success when it actually succeeded? If your job stamps a timestamp, marks a status, or returns 200 regardless of outcome, your monitoring is decorative. Success markers must be earned, not automatic.
3. Does a failure reach a human, exactly once, without being swallowed? A caught exception that gets logged quietly and never escalated is the same as no error handling at all, except it feels responsible. Failures need to leave the machine and land in front of a person, one time, clearly.
4. Is staleness visible to the people relying on the data, not buried in a log? The users making decisions on your dashboard are not reading your logs. If the data is old, they need to see that where they work, not where your engineers occasionally look.
This applies to everything. Marketing syncs. Billing webhooks. Inventory feeds. AI agents running on a schedule. The mechanism differs, the failure mode is identical: a process that reports success while doing nothing.
And the cost scales with trust. The more you rely on an automation running unattended, the more expensive its silent lies become. A firm trusted zeros for two weeks because the system told them, in every way it knew how, that it was fine.
How to Know Your Automations Aren't Just Pretending
Here is the honest answer to the obvious question. The reason this firm trusted a broken dashboard for two weeks is that nobody had ever stress-tested the failure path. Not once.
Their system was built the way almost everything gets built: to demo the happy path. Connect the account, watch the data flow in, ship it. Nobody asked what happens when the token dies. When an API rate-limits. When a service returns garbage instead of an error. So when those things happened, the system did the only thing it knew how to do, which was keep going and report success.
When I build or audit a system, the failure path gets as much attention as the feature. Maybe more, because the feature is the part everyone already tested by using it. The failure path is the part that only runs when something goes wrong, which means it is the part that has never run at all until the day it matters.
If you have automations running unattended, and you have never actually watched one of them fail on purpose, you do not know whether they are working. You know they are quiet. Those are different things, and you just read 2,000 words about how expensive the difference can be.
That is the kind of audit I run. I go find the places your system is lying to you, and I make the lies impossible.
Thinking about AI for your business?
If this resonated, let's have a conversation. I do free 30-minute discovery calls where we look at your operations and find where AI could actually move the needle, and where your current automations might be quietly telling you everything is fine.
Get AI insights for business leaders
Practical AI strategy from someone who built the systems — not just studied them. No spam, no fluff.
Hodgen.AI
Ready to automate your growth?
Book a free 30-minute strategy call with Hodgen.AI.
Book a Strategy Call