Spatial Data Visualization: My AI Ops Floor Map
Why I turned my AI ops dashboard into a live spatial data visualization instead of a spreadsheet, and why I actually watch it now.
By Mike Hodgen
Nobody Watches a Dashboard That Looks Like a Spreadsheet
I had a fleet of AI agents running across a dozen projects at once, and I had no idea what most of them were doing. The telemetry was flowing fine. The problem was that I'd built the wrong way to look at it. My first attempt at spatial data visualization wasn't spatial at all. It was a table.
Session ID. Project name. Token count. Last tool call. Status. One row per active agent, sorted by recency. Technically complete. Genuinely useless.
I never opened it. Not because it was wrong, but because reading it cost more attention than I was willing to spend. A table forces you to read every row to understand the whole picture. By the time I'd parsed line 12, line 1 was already stale because these agents update constantly. The data was real-time, and the layout was anything but.
That's the core tension nobody warns you about. Real-time data and tabular layout fight each other. A table assumes the world holds still while you read it top to bottom. Live agent telemetry doesn't hold still. It moves while your eyes are still scanning, so you're always reading a snapshot that no longer exists.
The data itself was solid. I'd already built a live dashboard of every AI agent working for me on top of OpenTelemetry, so every session emitted clean structured events: tokens, tool calls, timestamps, parent-child relationships between agents and the subagents they spawned. The foundation was right. The surface was wrong.
I'd done the hard engineering part and then served it through the one interface that guaranteed I'd ignore it. A pile of numbers I had to decode is not monitoring. It's homework.
So I stopped trying to make the table faster and asked a different question. What if I didn't have to read it at all?
What Spatial Data Visualization Actually Means Here
Spatial data visualization means encoding data as position, size, motion, and proximity in a scene, instead of as values sitting in cells. You're not reading numbers. You're reading a picture, and the picture changes when the data does.
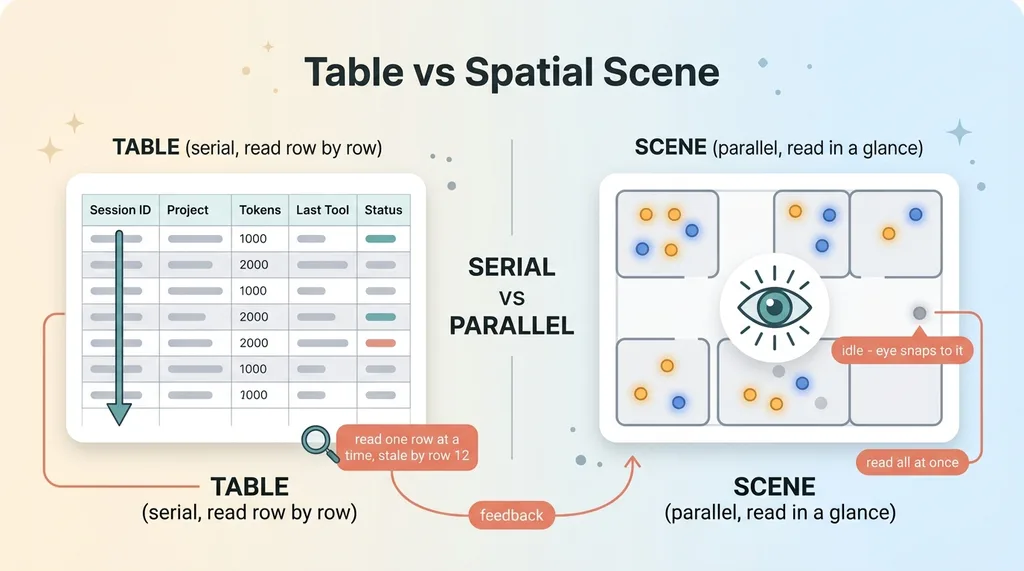 Table vs Spatial Scene comparison
The reason this matters comes down to how your brain works. You read a scene in a single glance. You read a table one row at a time. A spreadsheet is a serial format, processed line by line. A scene is parallel, processed all at once. For monitoring live systems, that difference is everything.
The cleanest example is a control room. An air traffic operator does not read a list of plane coordinates, altitudes, and headings. They look at a radar screen. Position is position. A cluster of dots converging is danger you see before you could ever read it. Same data, completely different cognitive load.
That's the principle I borrowed. My agents had a position in a logical sense (which project they belonged to), a size (how much work they were doing), and a state (active, idle, done). All of that is naturally spatial. I'd just been flattening it into text.
So here's the thesis for the whole rebuild. I turned my AI ops dashboard into a live floor map you could read in two seconds without reading anything. No parsing. No sorting. No squinting at token columns. Just a glance at a scene that told me, instantly, whether everything was healthy or something was off.
The goal wasn't a prettier dashboard. Prettier doesn't matter. The goal was a dashboard I'd actually look at, which meant one that demanded almost nothing from me to understand. Legibility at a glance was the entire spec.
Mapping Each Telemetry Signal to Something You Can See
This is where it gets real, because a scene is only useful if every visual property carries a data dimension. Decoration is noise. Each thing you can see has to mean something.
Rooms, avatars, and satellites
Each project became a room on the floor. A labeled area with its own space. If I was running ten projects, I saw ten rooms, and I instantly knew which corner of the floor belonged to which work.
Each active session became an avatar standing in its room. One agent, one figure, parked in the project it was working on. Glance at a room and you see how many agents are in it. Empty room, nothing running. Crowded room, heavy parallel work.
When an agent spawned a subagent to run a query or a side task, that subagent became a satellite orbiting its parent avatar. The orbit made the parent-child relationship visible without a single line of text. You could see at a glance that one agent had farmed out four subtasks because it had four things circling it.
Size, glow, and motion as data
Token usage drove avatar size and glow intensity. Heavy work meant a bigger, brighter avatar. A session burning through a lot of tokens physically dominated its room, so cost and effort were something you felt visually rather than added up.
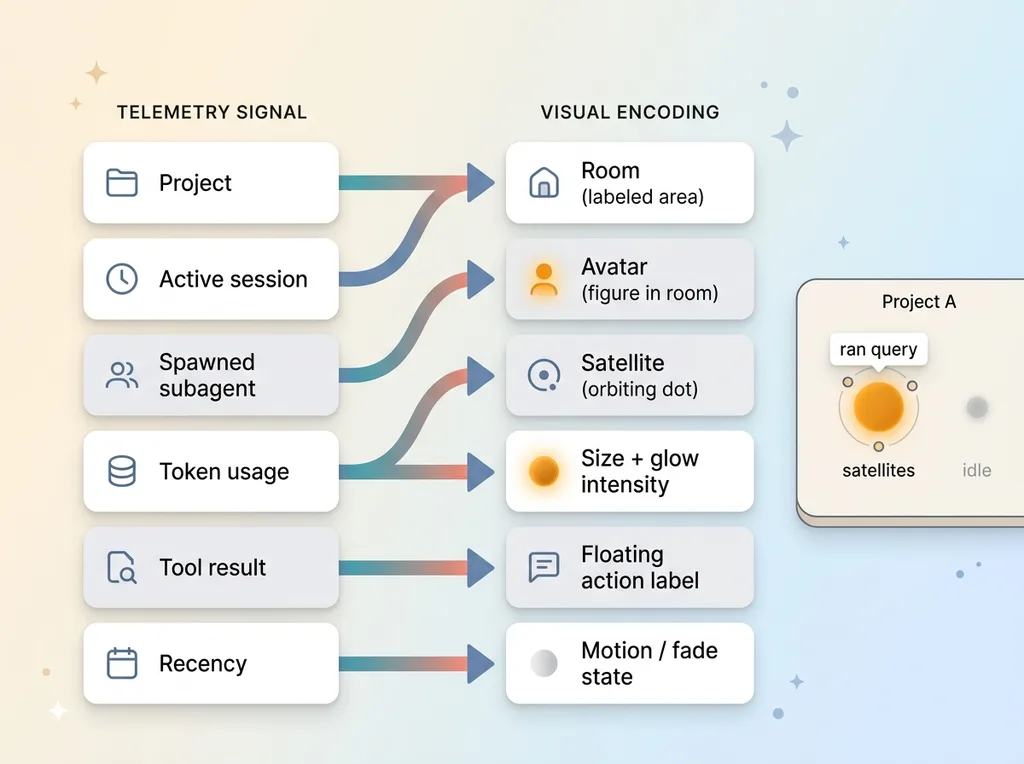 Telemetry signals mapped to visual properties
The current tool result became a floating action label above the avatar. A short bit of text that told me what the agent just did. Not a log to scroll. One line, hovering, current.
Recency drove status. An avatar working recently was active and animated. One that had gone quiet faded toward idle. A finished session settled into a done state. You read the health of the whole floor by motion alone.
The judgment calls mattered as much as the encoding. What I left out was as important as what I put in. I deliberately did not encode raw counts that never changed a decision. Total lifetime tokens, internal session IDs, exact timestamps to the second. All real data, all noise on a glance-level surface. Every property I added had to earn its place by changing something I'd actually do. If it didn't, it stayed off the floor.
The result was that I read five or six metrics at once without parsing a single number.
The Stack: A WebGL Renderer Over a Realtime Postgres Feed
For anyone wondering whether this is some heavyweight platform, it isn't. It's a renderer, a subscription, and a clean mapping layer. That's the whole thing.
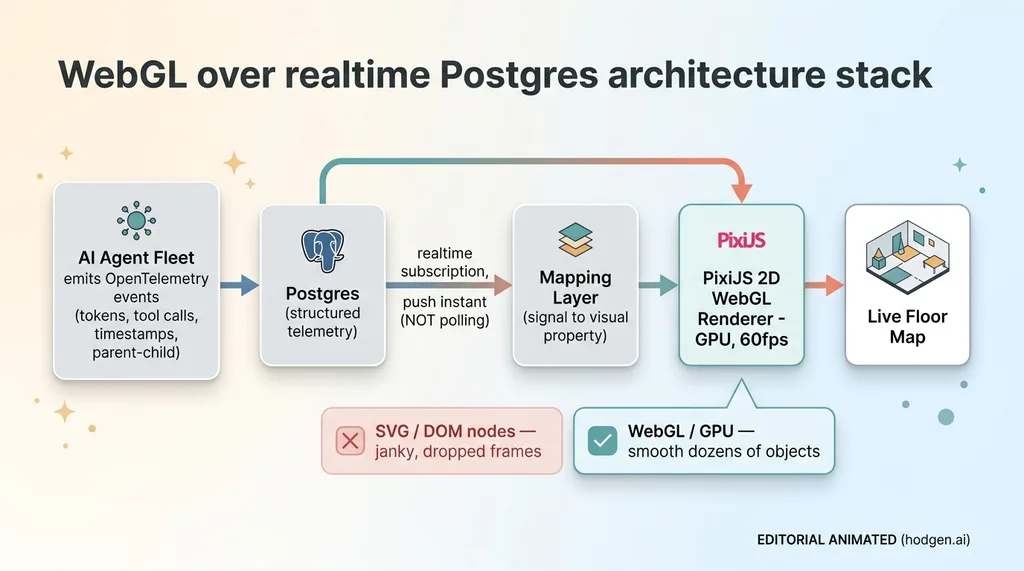 The WebGL over realtime Postgres architecture stack
The scene runs on a 2D WebGL renderer in the PixiJS class. WebGL because it's built to animate dozens of moving objects at 60fps without breaking a sweat. I needed avatars sizing up and down, satellites orbiting, glow pulsing, all simultaneously, all smooth. This is the part most people get wrong, so it's worth being blunt about it.
I did not use SVG or plain DOM nodes. DOM chokes the moment you try to animate dozens of elements at once. Every position change forces layout and paint work the browser was never designed to do at that scale. You get jank, dropped frames, and a scene that stutters right when you need it to be readable. WebGL pushes all of that to the GPU, which is exactly where animation belongs. I wrote up the full build in the spatial floor I built if you want the implementation details.
Underneath, the data comes from a realtime Postgres subscription that pushes telemetry the instant it lands. Not polling. I tried polling first, and it killed the entire premise. If the floor only updates every few seconds, an agent can spin up, run, and stall before you ever see it move. The legibility argument depends on the scene reflecting reality right now. A laggy floor map is just a slow table with extra steps.
The breaking point for the old table was running ten projects at once. Ten projects meant dozens of concurrent agents and their subagents, all updating constantly. No human reads a table that's rewriting itself every second. But ten rooms full of avatars, some glowing bright, one suddenly going still? That you read in a glance, no matter how many are running.
This is not magic. It's good plumbing serving a deliberate design.
What Changed When the Data Became a Scene
The honest result is simple. I went from never opening the dashboard to leaving it up on a second monitor all day. That's the whole win. A tool you ignore has zero value no matter how good the data is.
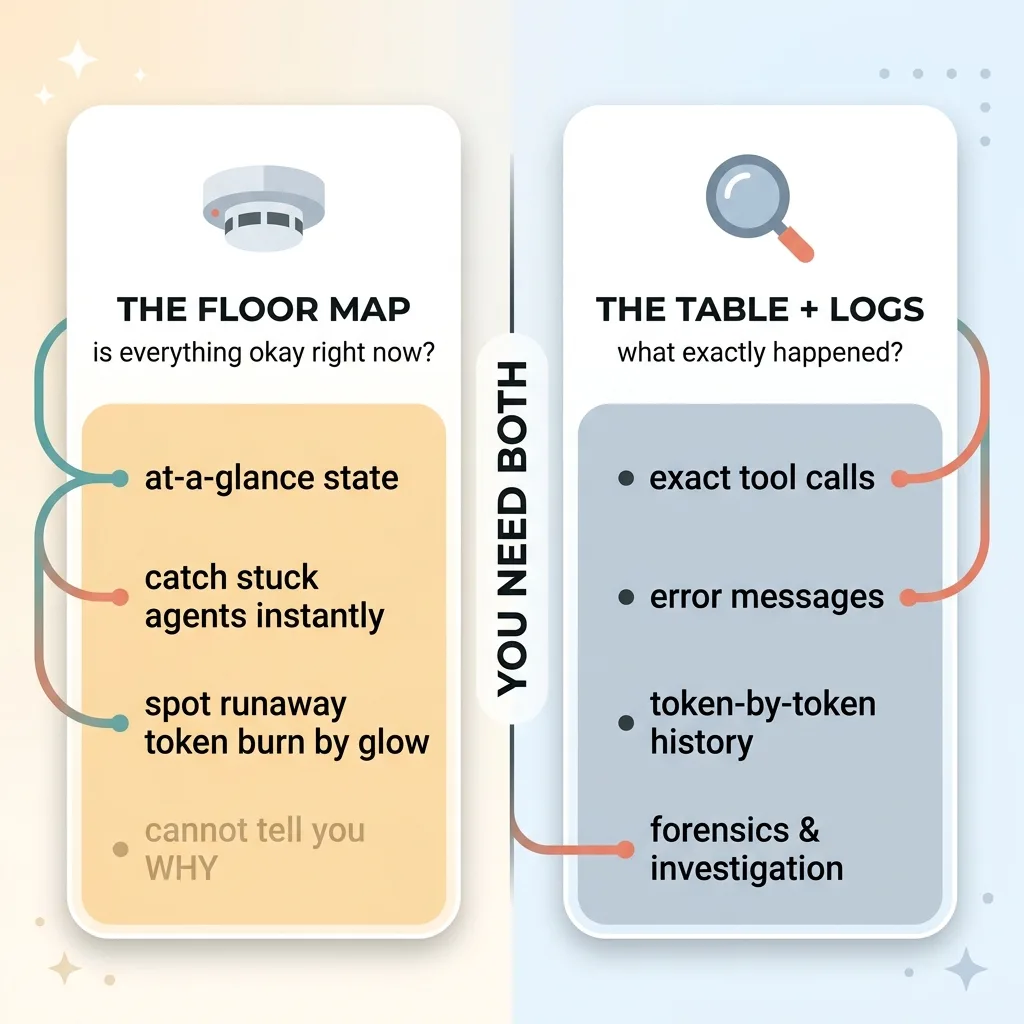 Smoke detector vs investigation - scene vs logs roles
I started catching stuck agents in seconds. An avatar going idle in a room that should be busy is instantly obvious. Something stops moving when everything around it keeps moving, and your eye snaps to it before you've consciously decided to look. In the table, that same event was a timestamp drifting a little further into the past. Completely invisible unless you were already reading that exact row.
I also caught a runaway token-burn session purely by its glow. One avatar was brighter and bigger than it had any right to be relative to the work around it. It looked wrong before I knew why it was wrong. I dug in and found a session stuck in a loop, quietly eating tokens. On the table that would've been a number among numbers. On the floor it was a beacon.
Now the honest limitation, because this matters more than the wins. A scene is excellent for at-a-glance state and terrible for forensics. When something actually breaks, the floor map can't tell me why. It tells me where to look and that's it.
So when an agent fails, I still drop straight into the table and the raw logs. That's where the exact tool calls, error messages, and token-by-token history live. The floor map is the smoke detector. The logs are the investigation. I never confused the two, and you shouldn't either.
The right way to think about it: the scene answers "is everything okay right now." The table answers "what exactly happened." You need both. I just stopped pretending one tool should do both jobs.
Why the Craft of a Monitoring Surface Is Not a Side Project
Here's a belief worth challenging directly. Most people assume internal dashboards are dry, throwaway tools. The thing you build last, build badly, and never touch again. Functional plumbing nobody's supposed to enjoy.
My experience says the opposite, and it's a more expensive lesson than it sounds. A monitoring surface only earns its keep if people actually look at it. And whether people look at it is a design problem, not a data problem.
My first table had perfect data and zero usage. The floor map had the same data and I leave it open all day. The data didn't change. The surface did. Every dollar I spent collecting telemetry was worthless until I built something a human would voluntarily watch.
There's a deeper point hiding in here. The same judgment that makes a tool legible is the judgment that decides what gets measured in the first place. Choosing not to encode raw token counts on the floor was the same instinct as choosing what to log at all. You're constantly deciding what matters enough to show and what's just noise dressed up as completeness.
A dashboard nobody watches is a line item, not an asset. It cost money to build and returns nothing because it sits unopened. The difference between a custom build that gets used every day and one that gathers dust is not technology. Both versions of mine used the same database. The difference was taste. The discipline to ask "what would actually make me look at this" instead of "what can I display."
That question is unglamorous and it's the whole ballgame.
If You're Building a Tool People Should Actually Use
Most of the custom tools I build for clients live or die on one thing: whether someone opens them on a Tuesday afternoon when nothing's on fire. Not in the launch demo. On an ordinary day, by choice.
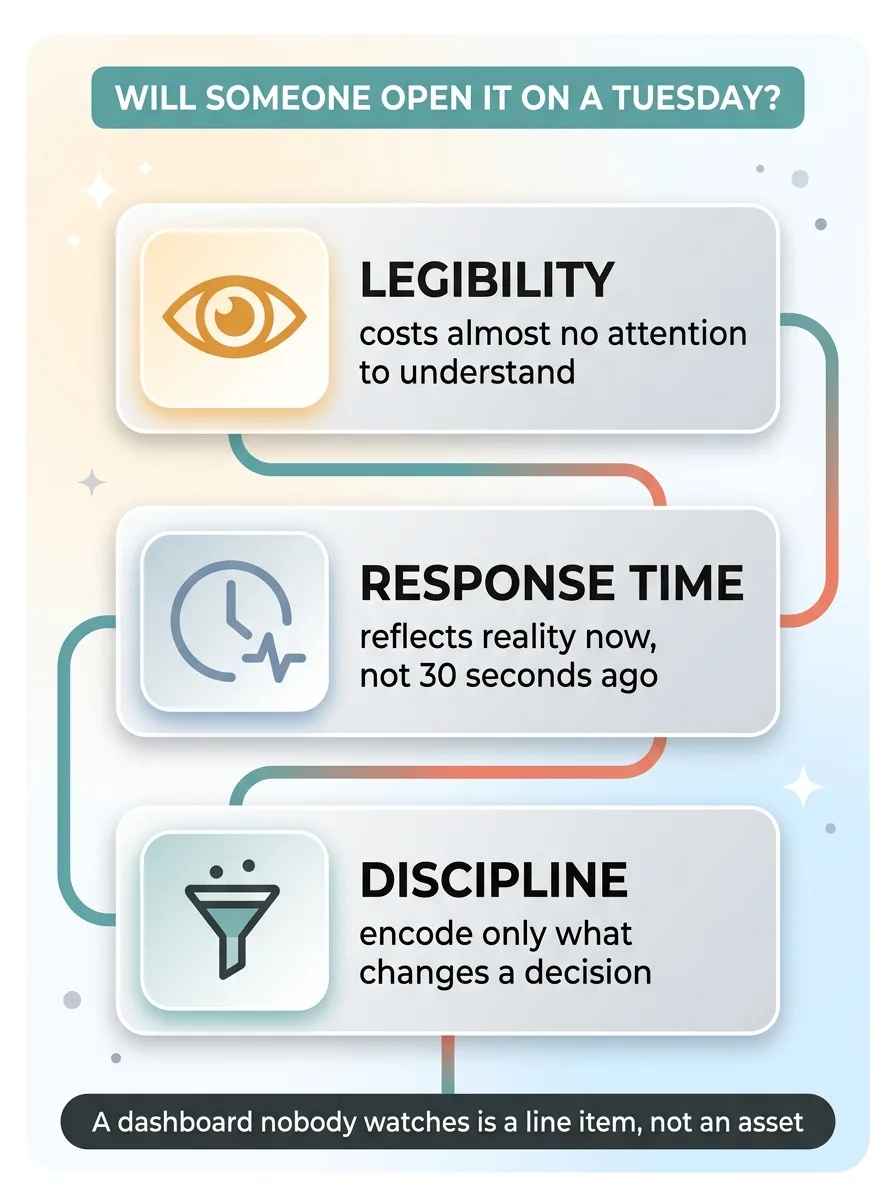 Three principles for a tool people actually use
That depends on three things. Legibility, so it costs almost no attention to understand. Response time, so it reflects reality now and not thirty seconds ago. And the discipline to encode only what changes a decision, so you're not drowning the signal in completeness nobody asked for.
If you've got data flowing somewhere nobody looks, the fix usually isn't more charts. It's a different surface entirely. More dashboards on top of an ignored dashboard just gives you two things to ignore.
I build these things to be used, not admired in a slide deck. If you want a tool your team will actually open, let's build something people actually use.
Thinking about AI for your business?
If this resonated, let's have a conversation. I do free 30-minute discovery calls where we look at your operations and find where AI could actually move the needle, not where it sounds good in a pitch.
Get AI insights for business leaders
Practical AI strategy from someone who built the systems — not just studied them. No spam, no fluff.
Hodgen.AI
Ready to automate your growth?
Book a free 30-minute strategy call with Hodgen.AI.
Book a Strategy Call